Tag Archives: Sea level rise

Climate clippings 102

This week we start with trouble at the top and bottom of the world and finish with trouble with our leading media magnate and politician.

1. Geenland at a tipping point?

THE cracks are beginning to show. Greenland’s ice sheets slid into the sea 400,000 years ago, when Earth was only a little warmer than it is today. That could mean we are set for a repeat performance.

If Greenland goes, West Antarctica also goes, giving 13 metres of sea level rise from those sources. If that happens there will also be a complete loss of other glaciers and ice caps, thermal expansion and some partial melting from East Antarctica. A mess!

The question is how soon and what can we do? The answer is we need more research and we need to think more in terms of centuries.

We should be thinking about the next 500-1000 years, how ice sheet decay can be minimised, stabilised and headed in the other direction. Our plans for the next 50-200 years should be made in the light of this.

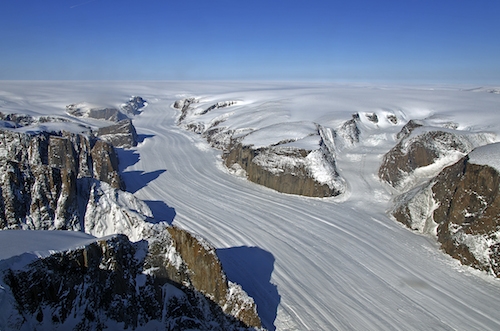
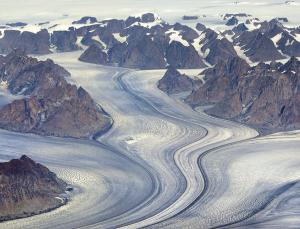
This image from the article shows a part of Greenland where the ice is quite dynamic.These areas are expected to grow.
New scientist_mg22229752.600-1_300

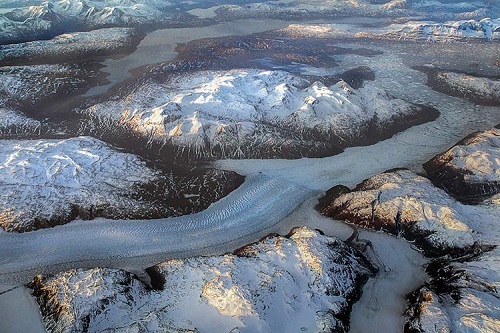
Here’s an image from another article:
greenland_cs_500

2. Big trouble in the Antarctic has been brewing for a long time

David Spratt at Climate Code Red:

“A game changer” is how climate scientist Dr Malte Meinshausen describes newly published research that West Antarctic glaciers have passed a tipping point much earlier than expected and their disintegration is now “unstoppable” at just the current level of global warming. The research findings have shocked the scientific community. “This Is What a Holy Shit Moment for Global Warming Looks Like,” ran a headline in Mother Jones magazine.

Meinshausen says this is new information. He says that the beaches we know and love all around the world will disappear. He also wonders what other nasty surprises lie this side of a 2°C temperature rise. Spratt says we told you ages ago it was coming, by James Hansen, for example and by himself and Philip Sutton in 2007.

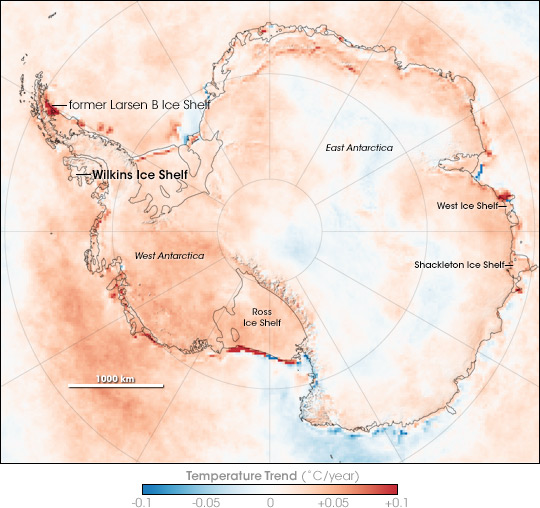
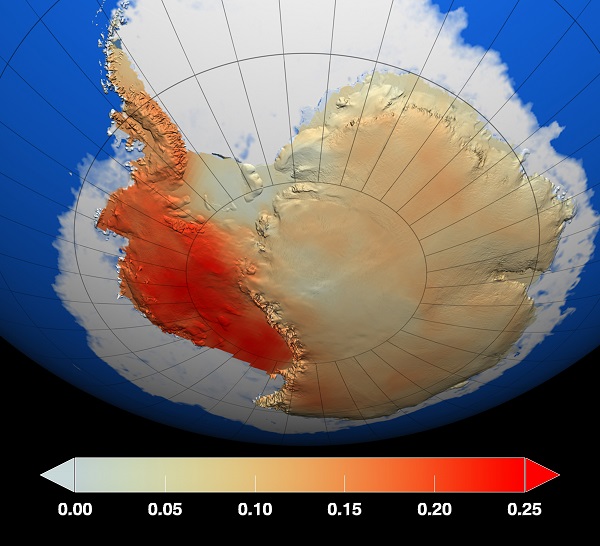
This NASA image shows the temperature changes from 1957 to 2006:
AntarcticaTemps_1957-2006_lrg_600

Hansen warned; Meinshausen says it’s happening. Spratt warns:

It’s par for the course for climate policy-makers to hope for the best, rather than plan for the worst. More than once this blog has warned that sea-level rises are being underestimated by Australian policy-makers, and that the tens of millions of dollars being put into adaptation planning for sea-level rises of no more than 1.1 metres by 2100 will be a waste of money, and all that work will have to be done again. And now that has come to pass.

3. Huge ‘whirlpools’ in the ocean are driving the weather

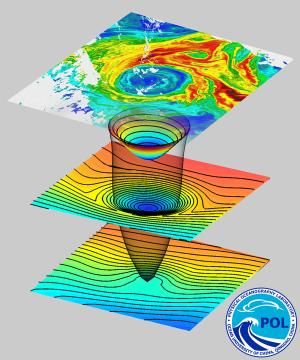
GIANT “whirlpools” in the ocean carry far more water than expected and have a big impact on the weather – though as yet we don’t know exactly what.

The areas of swirling water are 100 to 500 kilometres across. These “eddies” generally move west, driven by Earth’s rotation, until they stop spinning. Now, for the first time, the amount of water and heat they carry has been measured.

Article and image available also here.
dn25801_1_300

4. Gorgeous BioCasa_82

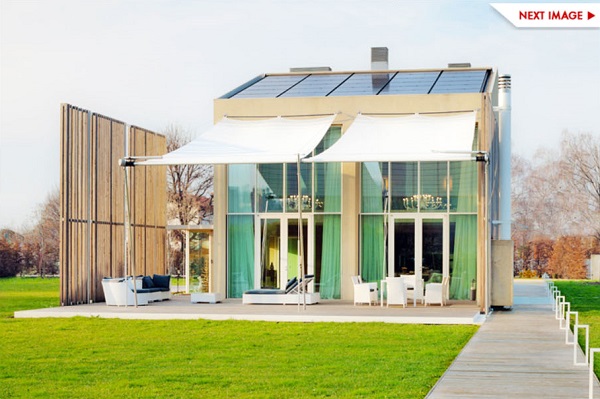
Nestled into the pastoral landscape of Treviso, Italy, BioCasa_82 is a beautiful home that boasts some seriously energy-efficient technologies.
BioCasa_82_cropped_600

The house is made from 99% recyclable materials and scores

117 points out of 136, according to the American protocol LEED Platinum, and 10 out of 11 points in regards to innovation in design, the building is a real gem in the European building practice.

According to the carbon footprint analysis, BioCasa_82 yields 60% less emissions than traditional buildings. Its photovoltaic system produces around 14kWh/mq of electricity, and a high-efficiency geothermal plant provides heat, hot water and cooling. These strategies are complemented by a rainwater harvesting system.

5. Rupert Murdoch doesn’t understand climate change basics

That is everyone’s problem since he owns a world-wide media empire.

Many of Murdoch’s news outlets are also among the worst when it comes to getting climate science wrong and disseminating climate myths and misinformation. Inaccurate media coverage is in turn the primary reason why the public is so misinformed about global warming.

I won’t go into the details, but Climate Progress observes that he ‘lowballed’ the numbers and minimized possible impacts. Here in Oz:

”We can be the low-cost energy country in the world,” he said. “We shouldn’t be building windmills and all that rubbish.”

Elsewhere Graham Readfearn finds that Tony Abbott’s views on climate are seriously crap.

Reminder: Use this thread as an open thread on climate change.

Climate clippings 101

A miscellany this week, with an emphasis on Australian policy and opinion.

The main links for each item is in the heading.

1. Kiribati buys land in Fiji

Millenium Island_9459385804_0e30488a67_k1-500

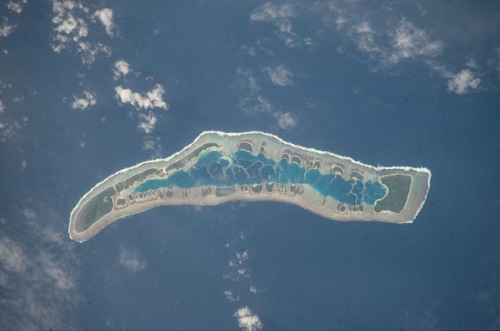
That’s Millenium Island in Kiribati which tops out at six metres above sea level. In parts of Kiribati the sea level is rising by 1.2 cm a year, about four times more than the global average.

Kiribati recently purchased eight square miles of land about 1,200 miles away on Vanua Levu, Fiji’s second-largest island. The immediate intention relates to food security. They will use the land for agriculture and aquatic farming.

That’s not a lot of land but Kiribati itself comprises just over 100,000 people scattered across 33 low-lying coral atolls totalling about 313 square miles.

The article notes that Kiribati’s reef structure can grow at 10 to 15 mm a year, faster than the IPCC expects sea level to rise, but it is not certain such growth in coral reefs translates to habitable land. My expectation is that later in this century sea level rise will far outstrip any coral growth.

2. Australians unhappy over Coalition’s response to climate challenge

JWS Research on behalf of the Climate Institute found that 70% of Australians accept the mainstream scientific position that climate change is occurring, up 10% since 2012.

while more than half of respondents felt the federal government was the primary body which should address climate change, there was a negative rating of -18 when people were asked to rank the government’s performance.

This compares to a -1 rating from last year.

A mere 20% of those questioned said they are convinced that Tony Abbott is concerned about climate change, with 53% feeling that he isn’t. Nearly a third of people believe opposition leader Bill Shorten is worried about the problem, with around the same proportion of people thinking the reverse is true.

In a further blow to the Coalition, for the first time more people support carbon pricing than oppose it. According to the poll, 34% back the carbon pricing laws, up 6% on 2012. Public opposition to carbon pricing has collapsed by 22% since 2012, when the Coalition was repeatedly attacking the then Labor government over the policy, the poll found.

According to the poll, 47% of people think that carbon pricing is preferable to no climate change policy, with just 22% supporting the government’s alternative Direct Action policy…

3. Shorten vows to ‘re-litigate’ case for carbon pricing

He didn’t expect to have to but he’s prepared to argue the case from first principles. He says:

The real test of political leadership is a willingness to build consensus, to earn agreement, not just to yank the bell at the Downton Abbey political college and expect a servant class of obedient Australians to carry out your will.

Meanwhile confusion reigns in the public mind, so I wish Bill the best of luck. Essential Research found:

Essential report_cropped_600

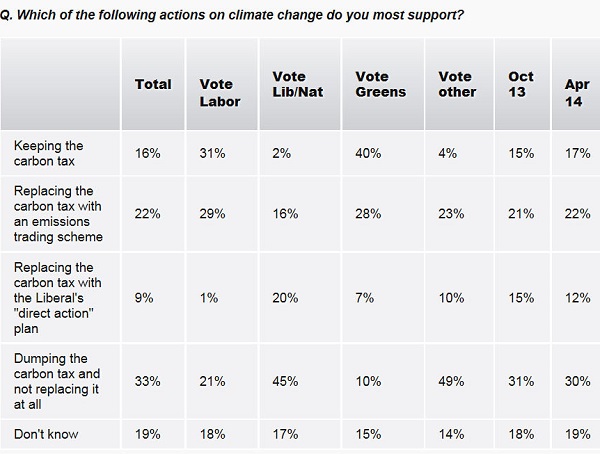
Support for Direct action is thin and fading in this survey at 9%. Doing nothing rates at 33% (up 3%), nearly matching the total of 38% favouring carbon pricing.

4. Great Barrier Reef tougher than thought

Scientists have put together temperatures from the Great Barrier Reef for the last 20,000 years and found that the reef has survived a range of temperatures.

They found that corals survived a 5°C rise between 20,000 years ago and 13,000 years ago. The reef is more resilient to temperature change than previously thought.

Nevertheless there are a few caveat’s to consider before a general outbreak of optimism,

Dr Helen McGregor, a Research Fellow at the Australian National University and a member of the research team:

“The Great Barrier Reef has coped with temperature changes that have occurred over a few thousand years, but now we are looking at a four degrees Celsius temperature change occurring in 100 to 150 years, so it is much more rapid.”

Then there is the small matter of ocean acidification and other human-caused impacts.

5. Abbott slams green power industry

That was the headline on the front page of the Australian Financial Review on Wednesday. On the front page we read the Abbott spiel:

“The RET is very significantly driving up power prices,” Mr Abbott said.

This, he said. posed a threat to domestic budgets and industry competitiveness, especially energy-intensive industries.

“We should be the affordable energy capital of the world, not the unaffordable energy capital of the world and that’s why the carbon tax must go and that’s why we’re reviewing the RET.”

Then over on page four we read the truth:

ACIL modelling for the Warburton review finds keeping the RET will cut average household power bills by $56 per year by 2021-2030 [sic] and extending it to 30 per cent will save householders $158. Source ACIL Allen

Andrew Richards, head of external affairs at Pacific Hydro, said recently approved gas price rises in NSW will add up to $240 a year to the average household bill. There are bigger fish to fry.

It’s a pity that the AFR can’t tell the truth on the front page – that Tony Abbott is telling porkies again.

Reminder: Use this thread as an open thread on climate change.
The game is up

In the post A choice of catastrophes: the IPCC budget approach I explained the socalled ‘carbon budget approach’ in some detail. In general terms:

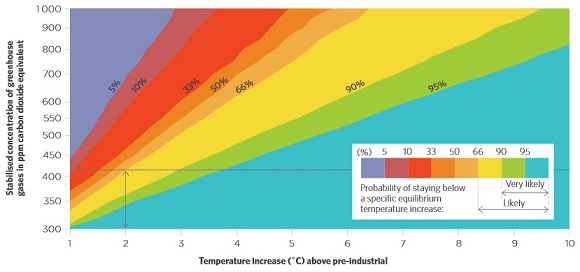
    In a warming world what matters is the total quantum of CO2 in the atmosphere. The ‘climate budget approach’ identifies the total anthropogenic CO2 emitted to cause warming of 2°C. For a 66% chance of staying under 2°C the total CO2 emitted must not exceed 1000Gt, according to calculations done by Malte Meinshausen and others back in 2009. The later we leave cutting the harder we have to cut.

Rahmstorf’s budget was about 1000Gt of CO2 or about 1500GT of CO2 equivalent with other greenhouse gases for a 25% chance of staying within 2°C. Then

    as Giles Parkinson reports, the carbon budget figures have taken a haircut to become 800Gt for a 66% chance of 2°C when “accounting for non-CO2 forcings”. Problem is we’d already used up 543Gt of the budget by 2011.

David Spratt now tells it straight: Continue reading The game is up

Climate clippings 98

This edition includes important updates on Greenland and Antarctica, global food supply, CSIRO cuts, CO2 levels moving decisively past 400 ppm and CO2 compared to global temperature rise.

1. Greenland may melt faster than expected

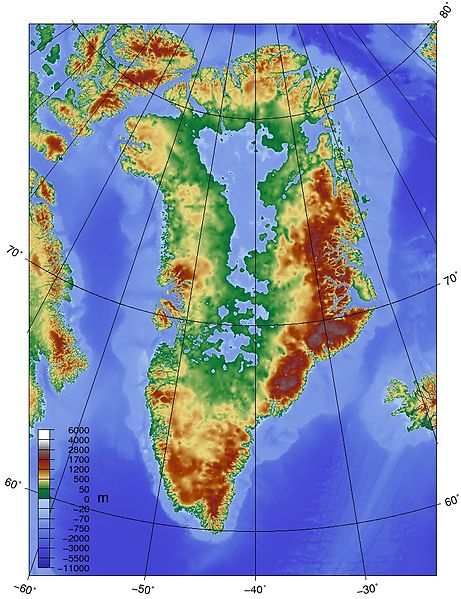
You may recall from the post Arctic images I included an image of the underlying topography of Greenland (Figure 5). It is saucer-like with large areas inland below sea level. The glaciers tend to drain through narrow gateways in the external rim. So they tend to be narrow and fast-flowing:

Glacier_assets-climatecentral-org-images-uploads-news-5_16_14_Andrea_Greenlandglacier-500x331

The mouths of most glaciers are melting from contact with warmer seas. It was felt that as this process continued the ice would lose contact with the water, slowing the melting.

New studies of the topography have shown that many of these channels are below sea level.

Valleys underlying many of the glaciers stay below sea level and extend much farther inland than previously suggested, so warm ocean currents that have migrated northward with the changing climate could eat away at the ice for much longer than current climate models suggest. “It will take much longer for these glaciers to lose contact with the ocean,” study author Mathieu Morlighem, of the University of California, Irvine, told Climate Central.

2. Melting Antarctica could devastate global food supply

A new report is the “first to factor in the effects of the slow-motion collapse of the Western Antarctica ice sheet on future food security.”

About time, I’d say.

The report acknowledges recent findings that that the retreat of the Western Antarctica ice sheet was unstoppable – and could lead to sea-level rise of up to 4 metres over the coming centuries.

“That sea-level rise would take out half of Bangladesh and mostly wipe out productive rice regions in Vietnam,” Nelson told The Guardian. “It would have a major effect on Egyptian agricultural areas.”

“A sea level rise of 3 meters (10 feet) over the next 100 years is much more likely than the IPCC thought possible,” the report said.

In terms of absolute land loss, China would be at risk of losing more than 3 million hectares (7.4 million acres). Vietnam, India, Bangladesh, and Myanmar could lose more than 1 million hectares (2.5 million acres), the report said.

The report recommends a radical increase in expenditure on agricultural research, which has been in decline everywhere over recent decades.

3. CSIRO cuts

The federal government cut CSIRO’s funding by $111 million over four years, which will result in 500 job cuts.

Dr Borgas [president of the CSIRO Staff Association] said a plan to move the Aspendale Laboratories to the organisation’s larger site in Clayton had been previously discussed but had come to nothing.

He said it was unclear whether the relocation would reduce the research performed by the 130 staff, which includes ice core analysis, air quality and pollution research and climate and atmospheric modelling.

Most countries planning for a future increase their scientific research funding.

4. CO2 levels decisively pass 400 ppm

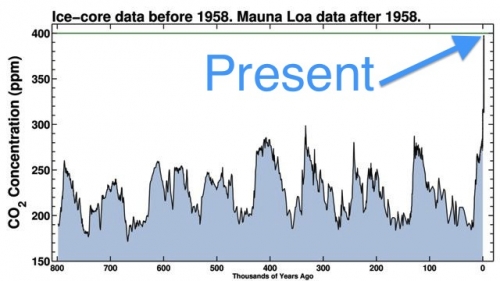
During April all 12 World Meteorological Organisation northern hemisphere monitoring stations passed the 400 ppm mark, the first time ever. This is how such a level compares to the 800,000 year ice core record:

assets-climatecentral-org-images-uploads-news-5_2_13_news_andrew_co2800000yrs-500x282

When was it last this high? Possibly 15 million years ago, when it was warmer and there wasn’t much ice around.

“This was a time when global temperatures were substantially warmer than today, and there was very little ice around anywhere on the planet. And so sea level was considerably higher — around 100 feet [30 metres] higher — than it is today,” said Pennsylvania State University climate scientist Michael Mann, in an email conversation. “It is for this reason that some climate scientists, like James Hansen, have argued that even current-day CO2 levels are too high. There is the possibility that we’ve already breached the threshold of truly dangerous human influence on our climate and planet.”

5. Global temperature and CO2

I came across this graph from the NOAA National Climatic Data Center plotting CO2 levels against temperature rise. While correlation does not mean causation there is simply no alternative explanation.

assets-climatecentral-org-images-uploads-gallery-TVM-Global_Temp_and_CO2_web-600

If you take out 1998, which can be regarded as an outlier, the socalled ‘pause’ is only apparent from 2005, which is too short a time to mean anything.

There is another view which sees temperature responding in step-wise fashion. On that basis we may be due for another step, and with an El Niño likely…

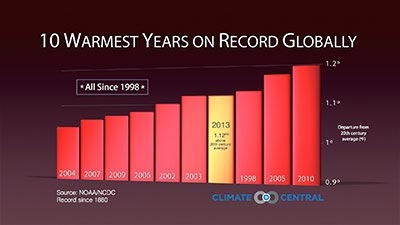
Here’s one showing the ten warmest years on record, all since 1998:

assets-climatecentral-org-images-uploads-gallery-climate-matters-GlobalRecapRanking_sm-400x225

Reminder: Use this thread as an open thread on climate change.
Antarctic images

In this post I’ve included a series of explanatory images of the Antarctic in order to assist understanding the peril we are in from changes there, and why the Antarctic is going to be central to the climate change story over the coming centuries. What happens to the grandchildren of those who are children now is the big concern. In large part these images relate to items 2-4 of Climate clippings 96.

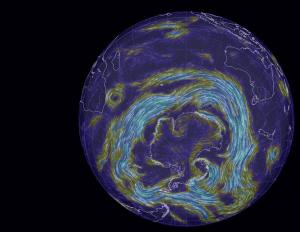
The first shows the giant vortex of winds, the strongest for at least 1000 years, ripping around Antarctica in a tight circle:

Figure 1
Figure 1

These winds draw rain away from southern Australia, and isolate Antarctica to some extent in terms of atmospheric warming. But they also churn up the ocean, leading to deeper mixing of heat and greenhouse gases.

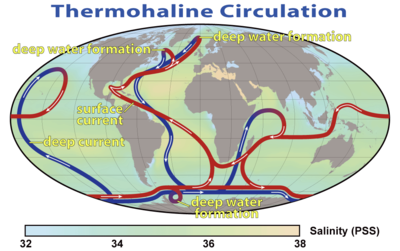
Both the deep and the shallow formations of the thermohaline circulation system wrap themselves around the Antarctic:

Figure 2
Figure 2

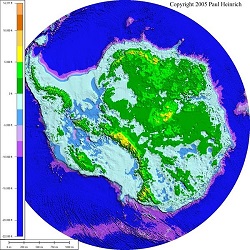
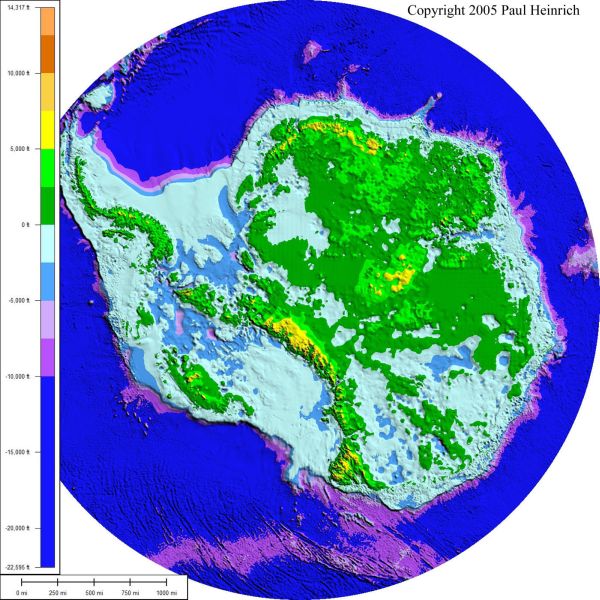
One way or another warm water is penetrating through to Antarctica. The underlying topography of Antarctica reveals much of the land lying below sea level:

Figure 3
Figure 3

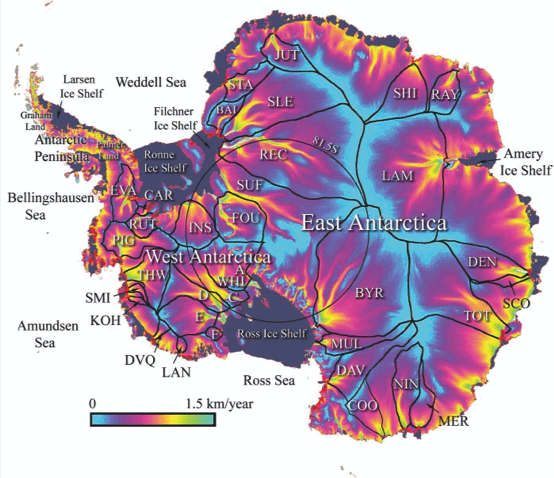
The borderline between blue and green marks sea level. Warmer water is coming directly into contact with the ice sheet and chewing away at the bottom of the ice shelves which form plugs holding up vast quantities of ice in the glaciers stretching hundreds of kilometres inland. The following image shows how the continent drains:

Figure 4
Figure 4

There is concern now that West Antarctica has tipped and with East Antarctica also more vulnerable than previously thought, sea level rise of some metres is now inevitable even if we were to somehow instantly curb greenhouse emissions.

Greenland is quite a different problem. For starters the underlying topography is saucer shaped, with glaciers exiting to the sea through ‘gates’. This image shows the topography:

Figure 5
Figure 5

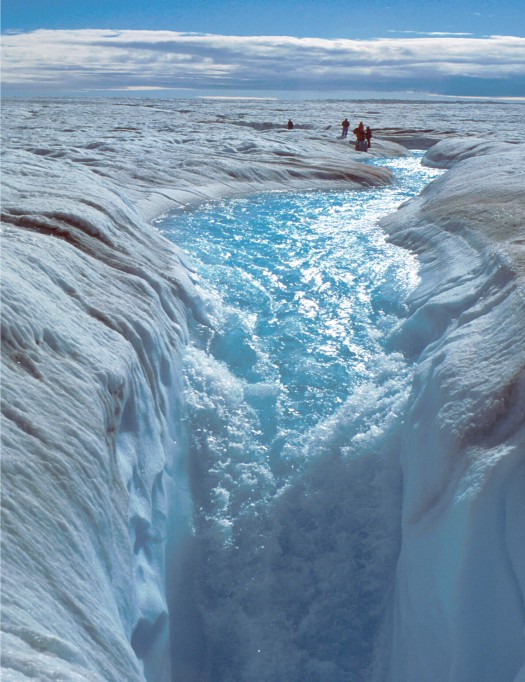
Greenland melts very much from the surface, so its largely a matter of meltwater penetrating, indeed plunging at times, through the surface to the rock below and glaciers speeding up. This image shows some people standing where I’d never stand:

Figure 6
Figure 6

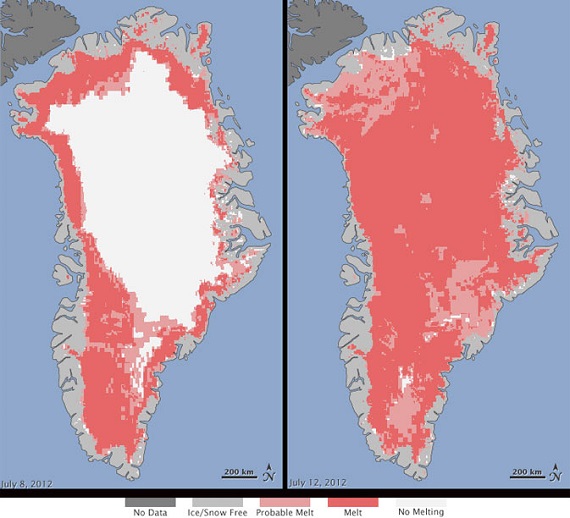
This image shows melting covering the entire Greenland ice sheet for a few days in 2012:

Figure 7
Figure 7

The panel on the left shows a more typical summer melt pattern, which is advancing noticeably over short time frames of a few years.

In the Antarctic, this image shows surface warming over the period 1981-2007:

Figure 8
Figure 8

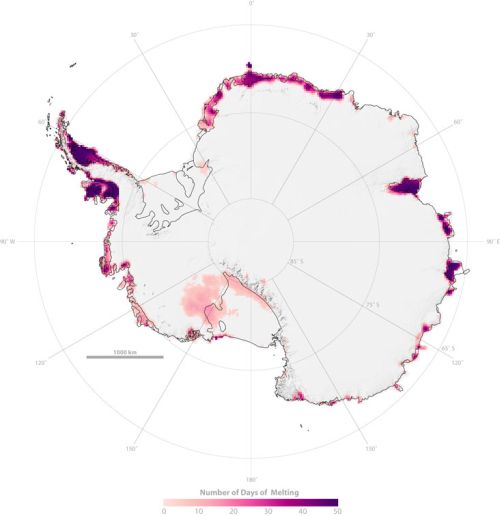
But with the average temperature around -39°C on the East Antarctic ice sheet, which is four kilometres high, that huge lump of ice is relatively stable. This image from NASA in 2005 shows significant perimeter surface melting around East Antarctica:

Figure 9
Figure 9

The new research sees concern that warmer sea waters may destabilise the ice further inland than previously thought. Match the red blobs on East Antarctica with the drainage map at Figure 4.

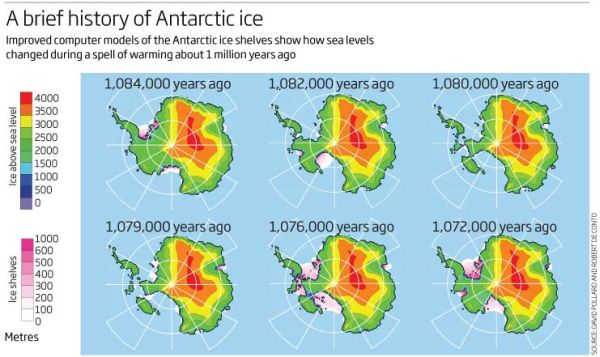
Of some some concern and some comfort is the Andrill Project which found that “the West Antarctic ice sheet has collapsed and regrown over 60 times in the past few million years”. This image shows what happened about a million years ago over a 12,000 year period:

Figure 10
Figure 10

Concern because the Andrill research shows what can happen with mild orbital forcing (the Milankovitch cycles) as the main driver. I understand that CO2 concentration back then was only 400 to 450 ppm, which is where we now, implying that we are already committed to wasting the West Antarctica ice sheet. There is some comfort, however, that a change in the orbital forcing, which is far weaker than what we are doing now, arrested the melt in West Antarctica and brought the ice sheet back again. There was no tipping point which saw the whole East Antarctic sheet disappear.

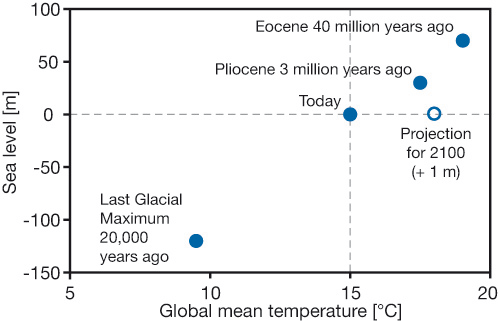
For perspective I’ll post one of my favourites, a graph from David Archer in 2006 showing the broad relationship between temperature and sea level:

Figure 11
Figure 11

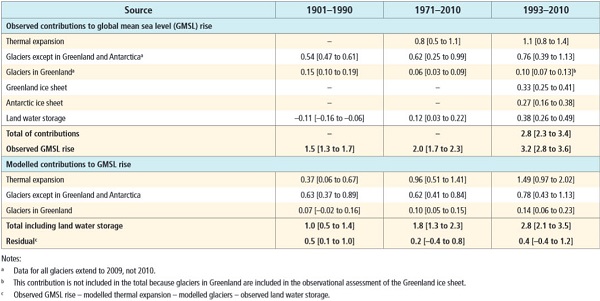
Do not connect the dots with straight lines. Most importantly, I think we now stand at the upper level of a 2°C interval where the sea level did not change much. The NH continental ice sheets had disappeared and the remaining ones – Antarctica, Greenland and the Arctic – were not seriously in play. Even now the main sources of sea level rise lie elsewhere. This table (13.1 from the IPCC5 WG1 Technical Summary) shows what’s happening:

Figure 12
Figure 12

That’s hard to read, so here are the figures for the average annual expansion for 1993-2010:

    Thermal expansion – 1.1mm

    Glaciers except Greenland and Antarctica – 0.76mm

    Glaciers in Greenland – 0.10mm

    Greenland ice sheet – 0.33mm

    Antarctic ice sheet – 0.27mm

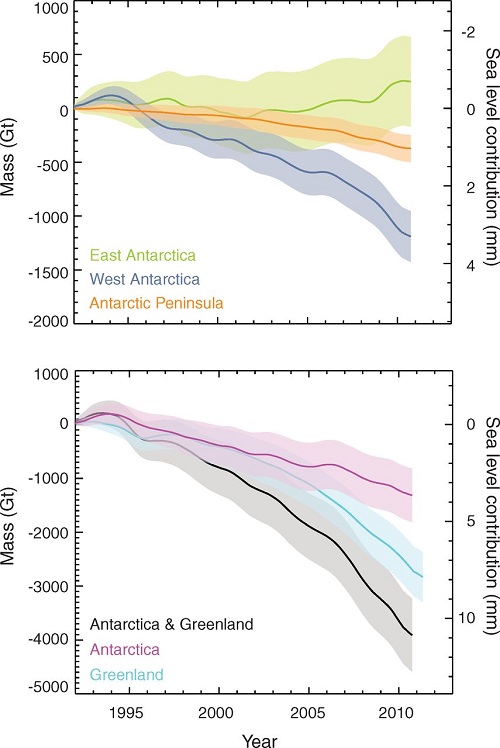
With 4-5°C we can expect complete deglaciation and 75 to 80m sea level rise, made up of East Antarctica 59m, Greenland 6-7m, West Antarctica 5-6m, other glaciers and ice caps about 0.5m and thermal expansion, I don’t know, but I think in single figures. Greenland and Antarctica are accelerating rapidly and some time this century will become the top two contributors. These graphs from Skeptical Science are instructive:

Figure 13
Figure 13

Greenland and West Antarctica are in a death spiral of accelerating ice sheet decay. It’s happened 60 or more time before in recent paleo history. West Antarctica, being more vulnerable may overtake Greenland.

One could say from this that East Antarctica is not yet in play, but science seems to suggest it is not far away.

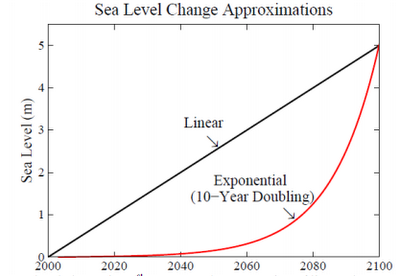
When ice sheet decay gets going Hansen sees it as possibly progressing in geometric fashion, producing a curve like this:

Figure 14
Figure 14

My thinking is that East Antarctica will tip sometime in the next decade, and that ice sheets will decay from there in a pattern that is more exponential than linear. Hansen’s scenario, which he puts forward as a serious possibility, does not look crazy.

I suspect that we are already committed to double digit sea level rise, and there’s not a thing we can do to prevent it; the question is when will it happen? We can only adapt and minimise.

I suspect also that things will go seriously pear-shaped during the latter part of this century. Pity our grandchildren’s grandchildren.

Update: There is a short ABC video news item about the Antarctic ice melt doubling since the last survey. At the end it says the process could take 1000 years. For a complete melt that would be lightning fast – 7.5 to 8 metres per century, or a metre every 12-13 years. We are pushing the system more than 10 times faster than it has ever been pushed before.

See also Gareth Renownden Goodbye coastline: we are beyond the point of no return.

Experts have a say on sea level rise

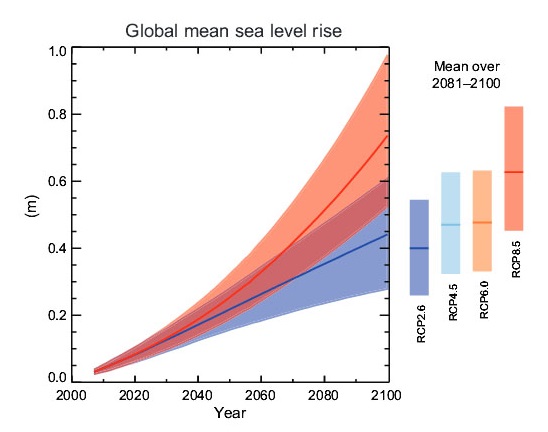
The recent IPCC report estimated sea level rise (SLR) thus:

SLR by 2100_cropped

For the scenario RCP8.5 (the most likely) the rise by the year 2100 is 0.52 to 0.98m, with medium confidence.

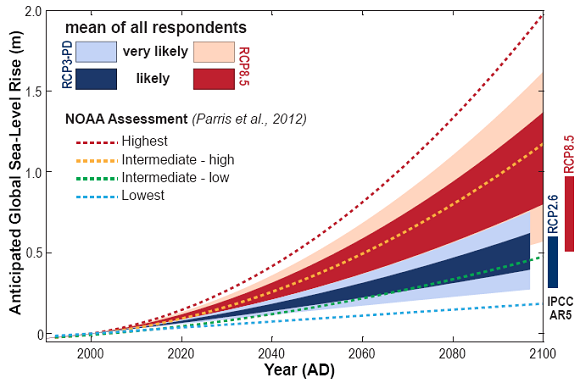
A new study (Horton, Engelhart and Kemp) asked experts in the subject for their view. For the RCP8.5 scenario they came up with 0.7 to 1.2m, as shown here:

Horton_SLR_Survey_580

Fully 65% of experts expect SLR greater than the IPCC forecasts.

The dotted lines on that graph represent NOAA projections of December 2012.

Meanwhile if, against the odds, we can hold temperature rise to about 2°C, then what happened during the last interglacial, the Eemian, has some relevance. This from the IPCC report: Continue reading Experts have a say on sea level rise

Climate clippings 89

Climate clippings_175These posts are intended to share information and ideas about climate change and hence act as a roundtable for readers to contribute items of interest. Again, I do not want to spend time in comments rehashing whether human activity causes climate change.
This edition is a mixture of science and implementation issues that found me rather than I found them. A couple came from Mark’s Facebook. The last item was drawn to my attention by John D.

1. Electric tents

If you want a tent for the holiday period that stands out from the pack and generates enough electricity to power computers, phones, cameras and loud speakers then
Bang Bang Tents is for you.

Bang Bang tents_cropped_500 Continue reading Climate clippings 89

Commentary on IPCC WG1: Part 2

In Part 2 of the round-up of commentary on the IPCC WG1 report I’ve tried to highlight where people have said something new or not emphasised elsewhere. I’ve not attempted to cover the MSM.

That’s it as a round-up. I plan to revisit particular topics later when the IPCC have finished fiddling with the text and layout.

The following image is the temperature projections representing the most optimistic and pessimistic scenarios. Bear in mind that RCP2.6 is probably hopelessly optimistic and at present we are tracking to do worse than RCP8.5. Also what happens is not likely to be as smooth as the graphs the models spit out.

Temperature_cropped_580

Here’s the link to Part 1.

The New Scientist has a special on the IPCC report which appears not to be paywalled at least yet. Among the questions asked is, can we be sure that any big issues have been missed?

Not entirely, is the answer given, but the text really says, yes, we can be sure. Anything that can’t be well-measured, such as the leaking of methane from permafrost, has been set aside. Also impacts with low probability and higher threat. So the report is restricted to the well-understood knowns and thereby conservative.

Science writer Michael Le Page distils a 10-word bottom line: we have to leave most fossil fuels in the ground.

He points to Norway to illustrate the problem. They get nearly 60% of their electricity from renewable sources and plan to go carbon neutral by as early as 2030. But they will do this by buying carbon credits with the earnings of their fossil fuel exports.

Doug Craig at Climate of Change picks up on the theme. Energy companies are currently spending $600 billion trying to find more fossil fuels.

The Conversation has tagged a topic IPCC Fifth Assessment Report Continue reading Commentary on IPCC WG1: Part 2

Climate clippings 83

Climate clippings_175These posts are intended to share information and ideas about climate change and hence act as an open thread. Again I do not want to spend time in comments rehashing whether human activity causes climate change.
This edition contains items, exclusively, I think, in climate science and impacts. The thread is meant to function also as a roundtable to share information and ideas.

1. Climate change picked the crops we eat today

The New Scientist carries a story about how some cereals we know today were changed by the climate as we came out of the last ice age. Researchers at the University of Sheffield, UK took seeds of precursors of modern wheat and barley found with human remains in a 23,000-year-old archaeological site in Israel. They grew these together with four wild grass species that aren’t eaten today, but were also known to grow in the region at that time, and grew them under conditions replicating levels of CO2 then and also the higher levels when farming first arose 10,000 years ago.

All the plants grew larger under the higher levels of CO2, but the relatives of wheat and barley grew twice as large and produced double the seeds. This suggests the species are especially sensitive to high levels of CO2, making them the best choice for cultivation after the last ice age.

The team plan to look at whether other food staples around the world are similarly affected by elevated CO2 levels, for example millet grown in Asia and maize in North America. They also plan to compare the effects of CO2 on legumes such as peas. Continue reading Climate clippings 83

Pine Island Glacier spawns a giant iceberg

As David Spratt posted at Climate Code Red a giant crack has opened across the full width of the Pine Island Glacier (PIG) ice shelf, spawning a new iceberg about 720 square kilometres in area, roughly eight times the size of Manhattan Island in New York. This is about the best photo I can find:

Pine Island Glacier_dn23847-1_450

We’ll get some orientation first and then look at the implications. This image locates the PIG on the continent of Antarctica:

AntarcMapPelto-300x255

This image from the LiveScience photo gallery outlines the PIG basin:

Pine Island Gl;acier_pi-3-PIG_map_Bodentopograpfie_beschriftet_w

This basin together with the Thwaites Basin just to the south drains 40% of West Antarctica. These two glaciers alone could lead to sea level rise of half a metre by 2100 according to material cited by Spratt. Continue reading Pine Island Glacier spawns a giant iceberg

Global heating update

Little ice age_130421152401-270

Last month we had a look at the Bigger, better, new hockey stick from a study by Marcott et al. Since then Skeptical Science has a post on the phoney skeptical/denialist critique of the study. We now have a new study, Continental-scale temperature variability during the past two millennia, by 78 scientists from 24 nations analyzing climate data from tree rings, pollen, cave formations, ice cores, lake and ocean sediments, and historical records from around the world published in the journal Nature Geoscience. The study found:

There were no globally synchronous multi-decadal warm or cold intervals that define a worldwide Medieval Warm Period or Little Ice Age, but all reconstructions show generally cold conditions between ad 1580 and 1880, punctuated in some regions by warm decades during the eighteenth century.

The real interest was in the regional variations on a continental scale. Temperatures were identified for the Arctic, North America, South America, Europe, Asia, Australasia and the Antarctic. There was insufficient data for Africa. Continue reading Global heating update