Tag Archives: Oceans

Oceans heading for mass extinction

    a 2015 study found there is no techno-fix to prevent a catastrophic collapse of ocean life for centuries if not millennia if we continue current CO2 emissions trends through 2050.

A study published in May 2017 tells us that oxygen is depleting in the oceans two or three times faster than expected.

From Think Progress:

    by combining oxygen loss with ever-worsening ocean warming and acidification, humans are re-creating the conditions that led to the worst-ever extinction, which killed over 90 percent of marine life 252 million years ago.

Continue reading Oceans heading for mass extinction

Climate clippings 201

1. Australian fund managers short Tesla and Elon Musk

When Elon Musk dramatically promised to build a grid-scale battery in South Australia, the media was enthralled. Share traders and a string of Australian fund managers smirked. They’d seen it all before, and were shorting him in the market.

In that very week he was in the market with plans to raise $US1.15 billion in equity and convertible notes. I understand also that Tesla has gone strangely quiet about SA since then. Continue reading Climate clippings 201

Climate clippings 145

1. Is it climate change?

When the first named cyclone in July appeared off the Queensland coast some asked whether this was caused by climate change. My response would be that a single event is weather. Climate is about changes in the patterns of weather over time.

Carbon Brief has a post suggesting that climate change attribution studies are asking the wrong questions. Continue reading Climate clippings 145

Climate clippings 126

1. New research reveals extreme oxygen loss in oceans during past climate change

New research published this week reveals that vast stretches of the ocean interior abruptly lost oxygen during the transition out of the last ice age that occurred 17,000–10,000 years ago.

If that happened as a result of the relatively gentle forcing caused by changes in the Earth’s orbit, imagine what is possible now!

Like most of the life on the planet, the large majority of marine organisms need oxygen to live. Most marine life, from salmon, crabs, to shellfish, respires oxygen and many forms are intolerant of low oxygen seawater.

So-called ‘dead zones’ do contain life comprised of worms, bacteria, specialized urchins and bivalves, and other extremophiles, just not the kind of tucker we like to eat.

2. India ‘walking the talk’ on climate change

India is one country a bit allergic to discussing agriculture and climate pollution. They worry about feeding the millions. They also got a serve from Obama when he was there:

During a visit to New Delhi last month, Obama warned that the world does not “stand a chance against climate change” unless developing countries such as India reduce their dependence on fossil fuels.

India, as usual, is impervious to pressure, but the environment minister reckons they are doing their bit. New prime minister Narendra Modi is keen on renewable energy:

Since coming to power in May, Modi has pledged to increase India’s renewable energy in a bid to lower coal use and bring electricity to more than 300 million poor people currently without power.

Modi, who built up a solar industry in Gujarat state when he was chief minister, has set a target for India to have 100 gigawatts of solar capacity by 2022.

3. Abbott’s decline attributed to G20 Obama snub and climate change

On Newspoll Abbott’s net approval rating is now -44 (68% disapprove, 24% approve of how he is doing his job). Jason Wison says:

After a polling mini-recovery of sorts for Abbott between July and September, November – the month of the G20 and Obama’s address – marked a turning-point. Between September and November, Abbott’s always-poor net satisfaction ratings had improved and stabilised a little; from November they declined rapidly to where they are today. In some polls, Abbott now has more than half the voters saying that he should resign. November was also the month in which Bill Shorten decisively overcame Abbott as preferred prime minister, and Shorten’s lead is now wider than ever.

Wilson reminds us that Abbott refused to accept President Obama’s request to put climate change on the G20 agenda. Obama’s response was to kick off his stay with an address at the University of Queensland embarrassing Abbott with his references to Australia and climate change.

4. Maurice Newman wrongly claimed a UK charity had blamed the deaths of elderly people on renewable energy policies

Maurice Newman is of course Tony Abbott’s top science advisor. Graham Readfearn investigated his claim and found:

Newman is not only misrepresenting the charity’s position, he appears to be making up positions that the charity simply does not hold.

Also:

between 2004 and 2011 the average annual energy bill in the UK went up from £610 to £970.

Only £30 of that £360 increase was due to costs related to low-carbon power generation.

Most of the increase, the analysis said, was down to higher gas prices and network costs (maintaining poles and wires).

In my view, Newman’s attempt to pin the blame for the deaths of UK pensioners on renewable energy policies is either disgustingly dishonest or pathetically sloppy.

In the rest of the article Readfearn gives an explainer on how world surface temperature is measured.

5. Miocene temperatures

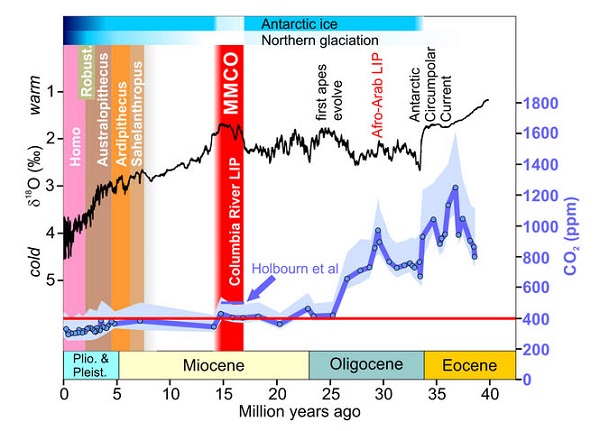
This Skeptical Science post gives a detailed account of what happened 14 to 17 million years ago in the “Mid Miocene Climate Optimum” (MMCO):

The MMCO was ushered in by CO2 levels jumping abruptly from around 400ppm to 500ppm, with global temperatures warming by about 4°C and sea levels rising about 40m (130 feet) as the Antarctic ice sheet declined substantially and suddenly.

Over the succeeding 2-3 million years Antarctic ice fluctuated dynamically in response to orbital wobbles, showing it was balanced on a knife-edge between a world with little ice and a world with substantial ice caps. Ice-free parts of Antarctica were rain-drenched and supported lush vegetation, while Arctic land was covered by temperate forests. Parts of the planet that had been arid before the MMCO rapidly re-greened and reforested (eg Patagonia).

This graph plots temperature and CO2:

Miocene_cropped_600

There were some differences between then and now. The Isthmus of Panama had not closed, for example. The warming happened on a warmer base.

Our warming is about 1000 times faster, giving less time for ecosystems to adapt. This is problematic for ocean acidification inter alia.

Climate clippings 109

1. Home solar power plus battery storage

It’s on the way, according to reports in Climate Progress and RenewEconomy. They are reporting on reports emerging from HBSC, Citigroup and UBS, so the big end of town is taking notice.

Initial interest is in short storage to cater for the peaks, but it seems that full storage systems will become competitive before the end of the decade.

For the next ten years battery technology is likely to remain lithium ion, with newer technologies introduced later.

2. Oceans warming faster than thought

The top 700 metres of the ocean have been warming 24 to 55% faster since 1970 than previously thought. The problem has been poor sampling in the Southern Ocean.

Of course this means that the whole planet has been warming faster than previously thought, since over 90% of the extra heat goes into the ocean.

3. Human hands caused 2013 heat

To me 2013 seems like a long time ago, but it is remembered for breaking a lot of heat records in Australia.

January 7 was our hottest day on record – 40.3°C.

January was the hottest month on record.

The 2012-13 summer was the hottest on record.

September was the hottest on record, exceeding the previous record by more than a degree; this was the largest temperature anomaly for any month yet recorded.

September-November was the hottest on record.

The whole year of 2013 was the hottest on record.

Five studies have now been done establishing human agency in these events. We don’t just need to be concerned about our grandchildren. Climate change caused by humans is happening now.

4. NOAA explains record Antarctic sea ice growth

First of all the record does not represent a dramatic increase on the recent average:
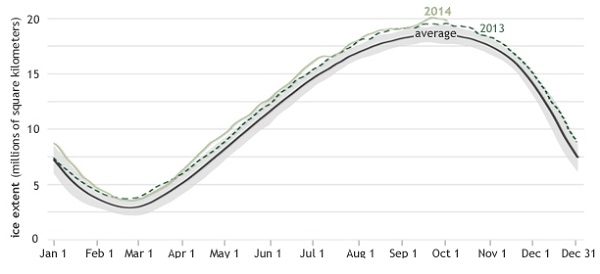
AntarcticSeaIceHistory_600

By comparison the loss of land ice has tripled in the last five years alone.

NOAA have now given a more detailed explanation of how the increase, counterintuitively, may be related to global warming. Firstly, it’s the wind:

NOAA first points out that “much of this year’s sea ice growth occurred late in the winter season, and weather records indicate that strong southerly winds blew over the Weddell Sea in mid-September 2014.”

Secondly, the melting land ice itself may have an effect:

Most of Antarctica’s ice lies in the ice sheets that cover the continent, and in recent decades, that ice has been melting. Along the coastline, ice shelves float on the ocean surface, and much of the recent melt may be driven by warm water from the deep ocean rising and making contact with ice shelf undersides.

How does the melting of land ice matter to sea ice formation? The resulting meltwater is fresher than the seawater. As it mixes with the seawater, the meltwater makes the nearby seawater slightly less dense, and slightly closer to the freezing point than the ocean water below. This less dense seawater spreads out across the ocean surface surrounding the continent, forming a stable pool of surface water that is close to the freezing point, and close to the ice onto which it could freeze.

5. Marshall Islands expendable

The United Nations chose 26-year-old Marshall Islands poet and mother Kathy Jetnil-Kijiner to be among the keynote speakers at the UN’s climate summit in New York recently. Here she is at the mike with her husband and child:

AP5150773745-500

Marshall Islands sits on average about 2 metres above sea level. Already she’s seen waves crashing into their homes and their breadfruit trees wither from salt and droughts.

Jetnil-Kijiner was confident in her speech that, no matter how difficult, climate change would be solved, and her daughter would be able to go on living in the Marshall Islands.

“No one’s drowning, baby,” she said. “No one’s moving. No one’s losing their homeland. No one’s becoming a climate change refugee…We are drawing the line here.”

She said, accurately I think, that saving the Marshall Islands meant “ending carbon pollution within my lifetime.”

Some 125 world leaders were present. Some, like ours stayed away, having more important things to do. Anyone present with half a brain must have known that is not going to happen. The Marshall Islands is expendable.

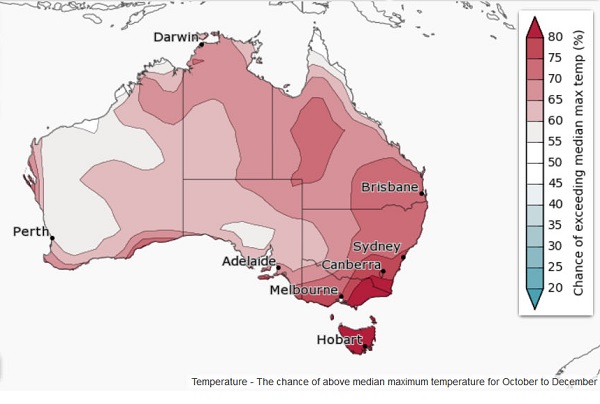
6. Climate outlook, October to December

In brief, warmer and drier than average, apart from Tasmania, which looks good for rain. There’s more detail and maps here.

This is what the rainfall prospect looks like:
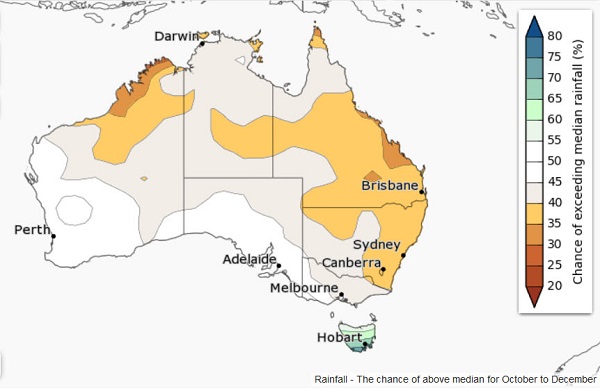
Oct-Dec 2014_cropped_600

And maximum temperature:

Temp Oct-Dec 2014_cropped_600

Six of eight international climate models suggest a late season El Niño, or near El Niño, ENSO state is likely.

Climate clippings 105

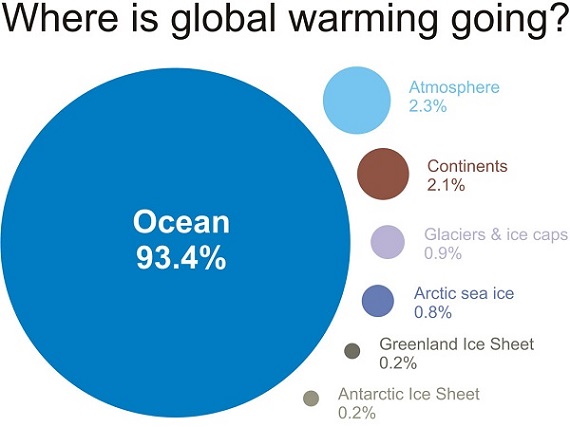
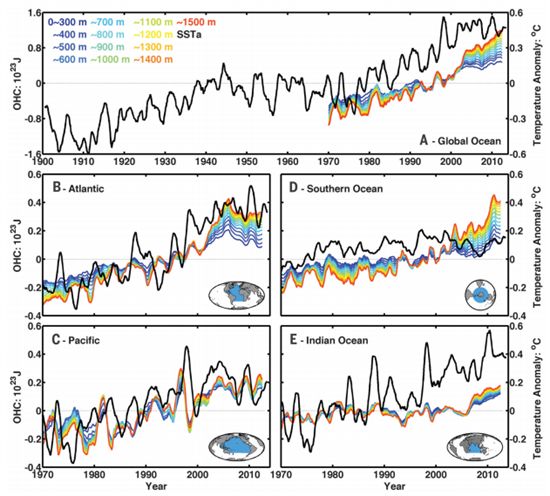
1. Atlantic Ocean important for heat storage

Most of the energy from global warming goes into the ocean as this graphic from Skeptical Science illustrates:

GW_Components_570

The linked paper stresses the role of the Atlantic in heat uptake. The following graph shows the heat uptake for the four main oceans. The black line is the sea surface temperature, the red line shows the heat below 1500 metres.

oceanheatuptake_chentung-2014-_550x496.jpg

All this is considered in relation to the socalled warming ‘hiatus’. The suggestion is that the Atlantic Meridional Overturning Circulation is the critical influence and it changes phase every 20 to 35 years. If so the ‘hiatus’ could last another decade or so.

Other scientists see the hiatus as multi-causal. It also depends which temperature series you are looking at. The HadCRUT temperatures always look flatter in recent years, as in this article. The Gistemp series from NASA has 1998 as about the third highest and shows a continuing upward trend, albeit slowed..

2. ‘Unprecedented’ ice loss in Greenland and Antarctica

Since 2009 the volume of ice loss has tripled in West Antarctica and more than doubled in Greenland, the highest rate of ice loss since satellite records began 20 years ago.

While it’s still early days, sea level rise this century could surprise on the upside.

3. El Niño watch

Carbon Brief also have the latest on the chances of an El Niño developing in 2014, which the Australian BOM now put at about 50%. Earlier there was talk of a super El Niño, which is still possible.

4. China gets into emissions trading

The Chinese national market will start in 2016.

The Chinese market, when fully functional, would dwarf the European emissions trading system, which is now the world’s biggest.

It would be the main carbon trading hub in Asia and the Pacific, where Kazakhstan and New Zealand already operate similar markets. South Korea will start a national market on Jan. 1, 2015, while Indonesia, Thailand and Vietnam are drawing up plans for markets of their own.

Looks like quite a trend. Time perhaps for Australia to join in!

5. World’s poor need grid power, not just solar panels

Small scale solar power is quite popular in Africa and supported by environmentalists. A few panels are able to run a few lights, a radio, charge the mobile phone but stop short of boiling a kettle. Critics see this as condemning the poor to a constrained future. Only 20% of Kenyans are connected to the grid.

Coal fired power is obviously not the answer. Dams take years to build, are typically over budget, inundate fertile lands or forest areas and interrupt natural stream flow.

In the Democratic Republic of Congo the mega project of the Inga 3 dam is due to start construction on the Congo River. If fully developed it will produce twice as much electricity as the world’s largest, the three Gorges in China. But will it be economically justified and what impacts will it have on the environment?

6. Emissions from energy generation jump after carbon price axed

Carbon emissions from the country’s main electricity grid have risen since the end of the carbon tax by the largest amount in nearly eight years.

Data from the National Electricity Market, which covers about 80 per cent of Australia’s population, shows that emissions from the sector rose by about 1 million tonnes, or 0.8 per cent, at an annualised rate last month compared with June.

That is the biggest two-month increase since the end of 2006, and came as a result of an increase in overall demand and a rise in the share of coal-fired power in the market, according to Pitt & Sherry’s monthly Cedex emissions index.

From what I can make of it, gas is increasingly going to export, there is some scaling back of hydro, presumably because of the weather. and large scale solar was killed off ages ago. The slack is being taken up by old coal, including brown coal.

Abbott’s strategy of saving the coal fired power industry seems to be working.

Building new more efficient coal would be his ultimate aim. This would involve investors and lenders having confidence in the future of coal. Surely they can’t be that stupid!

Reminder: Use this thread as an open thread on climate change.

Climate clippings 102

This week we start with trouble at the top and bottom of the world and finish with trouble with our leading media magnate and politician.

1. Geenland at a tipping point?

THE cracks are beginning to show. Greenland’s ice sheets slid into the sea 400,000 years ago, when Earth was only a little warmer than it is today. That could mean we are set for a repeat performance.

If Greenland goes, West Antarctica also goes, giving 13 metres of sea level rise from those sources. If that happens there will also be a complete loss of other glaciers and ice caps, thermal expansion and some partial melting from East Antarctica. A mess!

The question is how soon and what can we do? The answer is we need more research and we need to think more in terms of centuries.

We should be thinking about the next 500-1000 years, how ice sheet decay can be minimised, stabilised and headed in the other direction. Our plans for the next 50-200 years should be made in the light of this.

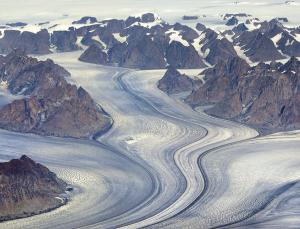
This image from the article shows a part of Greenland where the ice is quite dynamic.These areas are expected to grow.

New scientist_mg22229752.600-1_300

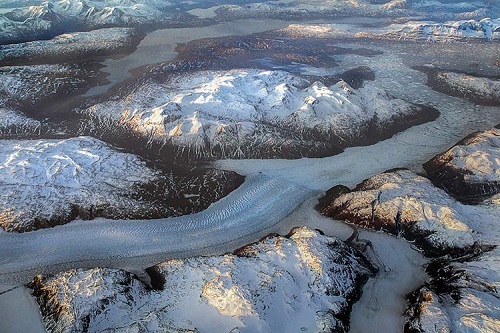
Here’s an image from another article:

greenland_cs_500

2. Big trouble in the Antarctic has been brewing for a long time

David Spratt at Climate Code Red:

“A game changer” is how climate scientist Dr Malte Meinshausen describes newly published research that West Antarctic glaciers have passed a tipping point much earlier than expected and their disintegration is now “unstoppable” at just the current level of global warming. The research findings have shocked the scientific community. “This Is What a Holy Shit Moment for Global Warming Looks Like,” ran a headline in Mother Jones magazine.

Meinshausen says this is new information. He says that the beaches we know and love all around the world will disappear. He also wonders what other nasty surprises lie this side of a 2°C temperature rise. Spratt says we told you ages ago it was coming, by James Hansen, for example and by himself and Philip Sutton in 2007.

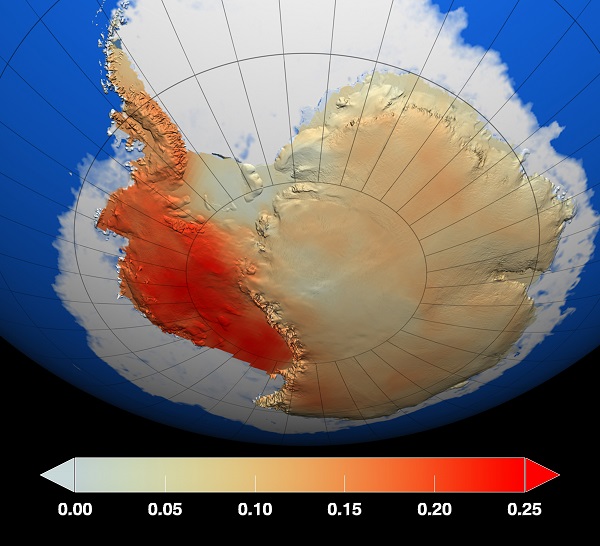
This NASA image shows the temperature changes from 1957 to 2006:

AntarcticaTemps_1957-2006_lrg_600

Hansen warned; Meinshausen says it’s happening. Spratt warns:

It’s par for the course for climate policy-makers to hope for the best, rather than plan for the worst. More than once this blog has warned that sea-level rises are being underestimated by Australian policy-makers, and that the tens of millions of dollars being put into adaptation planning for sea-level rises of no more than 1.1 metres by 2100 will be a waste of money, and all that work will have to be done again. And now that has come to pass.

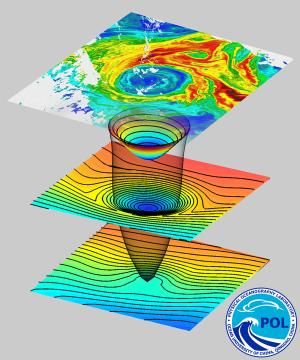
3. Huge ‘whirlpools’ in the ocean are driving the weather

GIANT “whirlpools” in the ocean carry far more water than expected and have a big impact on the weather – though as yet we don’t know exactly what.

The areas of swirling water are 100 to 500 kilometres across. These “eddies” generally move west, driven by Earth’s rotation, until they stop spinning. Now, for the first time, the amount of water and heat they carry has been measured.

Article and image available also here.

dn25801_1_300

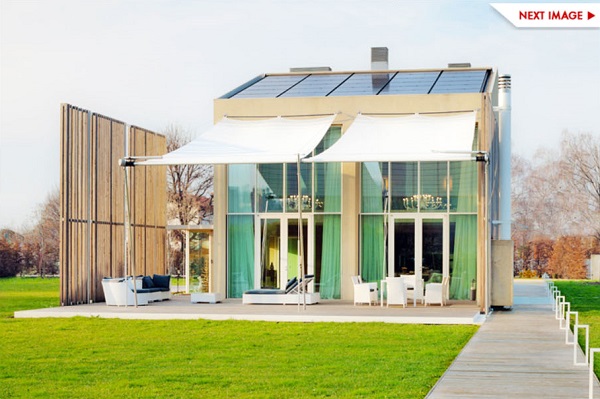
4. Gorgeous BioCasa_82

Nestled into the pastoral landscape of Treviso, Italy, BioCasa_82 is a beautiful home that boasts some seriously energy-efficient technologies.

BioCasa_82_cropped_600

The house is made from 99% recyclable materials and scores

117 points out of 136, according to the American protocol LEED Platinum, and 10 out of 11 points in regards to innovation in design, the building is a real gem in the European building practice.

According to the carbon footprint analysis, BioCasa_82 yields 60% less emissions than traditional buildings. Its photovoltaic system produces around 14kWh/mq of electricity, and a high-efficiency geothermal plant provides heat, hot water and cooling. These strategies are complemented by a rainwater harvesting system.

5. Rupert Murdoch doesn’t understand climate change basics

That is everyone’s problem since he owns a world-wide media empire.

Many of Murdoch’s news outlets are also among the worst when it comes to getting climate science wrong and disseminating climate myths and misinformation. Inaccurate media coverage is in turn the primary reason why the public is so misinformed about global warming.

I won’t go into the details, but Climate Progress observes that he ‘lowballed’ the numbers and minimized possible impacts. Here in Oz:

”We can be the low-cost energy country in the world,” he said. “We shouldn’t be building windmills and all that rubbish.”

Elsewhere Graham Readfearn finds that Tony Abbott’s views on climate are seriously crap.

Reminder: Use this thread as an open thread on climate change.

Climate clippings 92

Climate clippings_175 This is a continuation of the Climate clippings series familiar to readers of Larvatus Prodeo

While this edition was finished about a week ago I actually started writing stuff from about mid-February and have several others queued in the draft bin. They’ll be fed in periodically at the rate of perhaps more than one a week until I catch up with myself.

1. Strong El Niño rated an 80% chance

That’s according to Paul E. Roundy of the University at Albany, New York.

The sub surface temperature of the eastern Pacific Ocean is measuring an ‘astounding’ six degrees warmer than normal for this time of year.

The only time anything similar has happened was in March 1997, before the whopping 1998 El Niño.

An El Niño normally means dry conditions and reduced monsoons in Australia and Indonesia, but wetter weather in Central America.

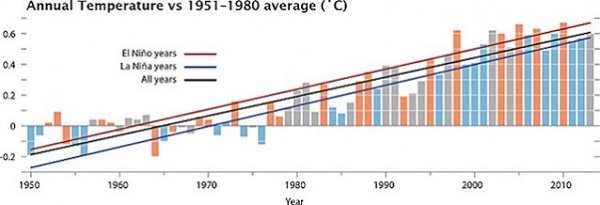
Climate Progress shows this interesting graph:

gistemp_nino_s-600

Since 1998 there have been six La Niña years warmer than any El Niño years prior to 1998.

At Mashable Andrew Freedman quotes the same people but found at least one scientist who thinks there’s perhaps a 40% chance there will be no El Niño at all.

Worth watching. Could be spectacular.

2. Wave and tidal energy

Climate Progress reports on wave energy projects at Morro Bay in California and elsewhere.

A 2012 report prepared by RE Vision Consulting for the Department of Energy found that the theoretical ocean wave energy resource potential in the U.S. is more than 50 percent of the annual domestic demand of the entire country. The World Energy Council has estimated that approximately 2 terawatts — 2 million megawatts or double current world electricity production — could be produced from the oceans via wave power.

3. The Pacific Ocean is turning sour

Much faster than expected, according to a new study.

Apparently CO2 concentrations are not uniform around the world and the tropical Pacific is getting more than its fair share. Hence the ocean in that area is acidifying faster than elsewhere.

4. Oxfam on food futures

From Huff Post, Oxfam has just completed a report (downloadable here) which suggests that climate change could delay the fight against world hunger for decades. Global food prices could double by 2030, with half the increase attributable to climate change. In the next 35 years there could be 25 million more malnourished children under the age of five than there would otherwise be.

Oxfam analyzed ten gaps that measured how prepared – or unprepared – 40 food-insecure countries are to tackle climate change impacts.

We assess ten key factors that influence a country’s ability to feed its people in a warming world – these include the quality of weather monitoring systems, social safety nets, agricultural research and adaptation finance.

As expected, the poorer countries will be most affected.

5. Will we still be able to have a decent cup of tea?

At the foot of the Huff Post Oxfam link above is a graphic showing the top “endangered” crops listing in order chocolate, coffee, beer (at least in Germany), peanuts, durum wheat to make pasta in Italy, maple syrup, honey, wine (at least in France). It must be said that I couldn’t find that list in the Oxford report which is mainly about staples such as rice and vegetables.

Now it seems that Assam tea is being affected by hotter, drier weather with more erratic rainfall. Indeed tea growing all over the world is becoming more difficult.

There’s more at the BBC.

6. More on global food security

A separate study found that from 2030 onwards, the world’s crop yields will be more and more impacted by climate change.

The study found that Sub-Saharan Africa and South Asia showed significant yield reductions for the second half of the century, while regions of the world with temperate climates, such as Europe and most of North America, could withstand a couple of degrees of warming without a noticeable effect on harvests, or possibly even benefit from a bumper crop.

One of the most important findings of this study is that adaptation may not be as effective for rice and maize as it is for wheat.

7. On the other hand

If you need a more cheerful story, here’s one about peasant farmer Vu Thi Ngoc who has adapted to crazy weather in the uplands of northern Vietnam by growing a different range of crops and changing farming practices.

It shows adaptability at work, this time with the help of CARE and Vietnam’s Agriculture and Forestry Research and Development Centre for the Northern Mountainous Region.

Reminder:

These posts are intended to share information and ideas about climate change and hence act as an open thread.

But as ever, I do not want to spend time in comments rehashing whether human activity causes climate change.

Climate clippings 80

Climate clippings_175In these posts the aim is to include eight segments averaging 125 words long with sufficient detail so that casual readers can get the sense of the featured article without following the links, which are there for those interested in more detail. Lately I have been alternating week by week collections of science/observations/predictions and practical matters associated with adaptation and mitigation.

During the last week of political distractions I have had about half my usual time at the computer. Moreover some segments just won’t fit within the 125 word constraint. Next cab off the rank, I hope, will be President Obama’s climate initiative, which demands extended treatment.

So for the next little while I’ll attempt to post whatever I have to hand every Tuesday until things settle down a bit.

As usual these posts are intended to share information and ideas about climate change and hence act as an open thread. And again I do not want to spend time in comments rehashing whether human activity causes climate change.

1. Climate change measuring instruments are on life support

That’s the story from John Abraham at Climate Consensus – the 97%. He is warning that many measuring systems, especially the satellite platforms, are headed for declines in coverage, which will lead to an information deficit. His worry is that straightened budgets will not allow replacement and hence continuity of information may be broken.

In a specific example, the Tropical Atmosphere Ocean (TAO) array, which consists of 55 oceanic moorings is involved in the detection, understanding and prediction of El Niño and La Niña, is only operating at 50%. Continue reading Climate clippings 80

Climate clippings 75

Climate clippings_175

1. The scientific consensus remains solid

Suzanne Goldenberg in The Guardian has the story. A study led by John Cook of Skeptical Science fame considered the work of some 29,000 scientists published in 11,994 academic papers between 1991 and 2011.

Of the 4,000-plus papers that took a position on the causes of climate change only 0.7% or 83 of those thousands of academic articles, disputed the scientific consensus that climate change is the result of human activity, with the view of the remaining 2.2% unclear.

The survey found that the consensus has grown slowly over time, and reached about 98% in 2011.

The study authors tell their story at Skeptical Science and the Guardian’s new blog.

Of the papers which specifically examine the contributors to global warming, they virtually all conclude that humans are the dominant cause over the past 50 to 100 years.

Continue reading Climate clippings 75

Climate clippings 73

In this edition I’ve stuck to scientific articles, and, incidentally have used a couple (items 3 and 4) from stuff I gathered around this time last year when I thought I might be launching a new blog. For reasons we won’t go into it didn’t happen at that time.

1. Arctic ice watch

While we were on sabbatical last year the northern cryosphere had an exciting time. There was a giant storm in the Arctic ocean, Greenland surface melt covered virtually the whole ice sheet and all sorts of records were broken in the Arctic summer sea ice melt. I’m hoping to do an update to catch us up, but follow this link to see a dramatic animation of Arctic sea ice volume loss since 1979. I’ve posted this image to show how far we’ve come:

volume-comparison-1979-2012-v4

You can monitor Arctic sea ice extent on the NSIDC site. This image is a screenshot from the interactive graph on that page showing the way summer sea ice is sagging:

Sea ice extent_cropped_580 Continue reading Climate clippings 73