1. Accelerating ice loss from Antarctica shelves
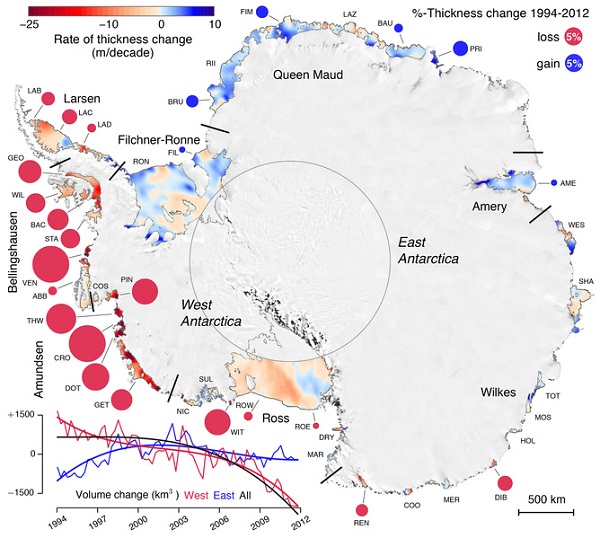
Some ice shelves in Antarctica are thickening and some are thinning. The pattern between east and west is obvious from this image:

When we sum up losses around Antarctica, we find that the change in volume of all the ice shelves was almost zero in the first decade of our record (1994-2003) but, on average, over 300 cubic kilometers per year were lost between 2003 and 2012.
According to the ABC story, some shelves lost almost 20% of their thickness.
Melting ice shelves does not itself cause sea level rise, but the shelves buttress land ice, which then becomes more mobile. The graph in the bottom corner of the image shows that East Antarctica is now also experiencing a net loss of ice from ice shelves.
2. Top polluters to set own limits virtually penalty free
ANU economist Frank Jotzo said the system is designed so no-one gets caught by it – a toothless tiger. Tony Wood of the Grattan Institute said the ideas proposed in the paper simply would not work. They were commenting on a Government consultation paper outlining “safeguards” to ensure the big polluters do not offset emissions saved through the Emission Reduction Fund (ERF), a flagship component of Direct Action.
Australia’s 140 top polluters will set their own limits for future pollution virtually penalty free, according to the Government’s latest Direct Action policy paper.
Companies subject to the safeguards will select a baseline, or limit, for future pollution.
That baseline will be set according to the highest peak of emissions from the past five years.
Just plain stoopid!
3. What’s going on in the North Atlantic?
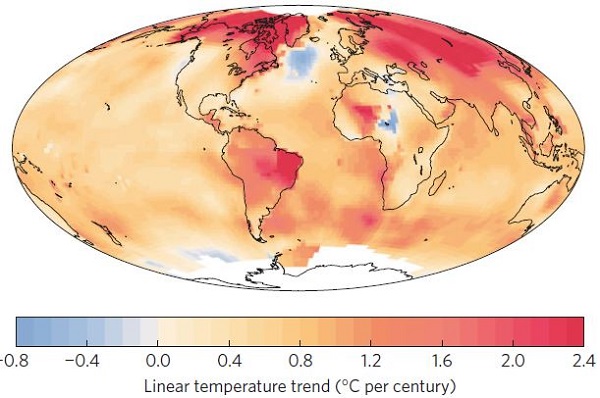
Stefan Rahmstorf asks the question at RealClimate. There is a large patch in the North Atlantic which has cooled in the last century.

Rahmstorf explains:
Our recent study (Rahmstorf et al. 2015) attributes this to a weakening of the Gulf Stream System, which is apparently unique in the last thousand years.
In fact during last winter, which was the warmest on record for the planet overall, this patch had the coldest temperatures on record.
Chief suspect has to be the increasing freshwater coming off Greenland. There will be consequences.
The consequences of a large reduction in ocean overturning would look nothing like the Hollywood film The Day After Tomorrow. But they would not be harmless either – e.g. for sea level (Levermann et al. 2005) particularly along the US east coast (Yin et al. 2009), marine ecosystems, fisheries and possibly even storminess in Europe (Woollings et al. 2012).
A complete breakdown of the current was given up to a 10% chance this century in the IPCC report. This may have been an underestimate.
4. Rapid Arctic warming is changing the Jetstream and the weather
Another study, also involving Rahmstorf, looks at changing atmospheric circulation patterns due to Arctic warming.
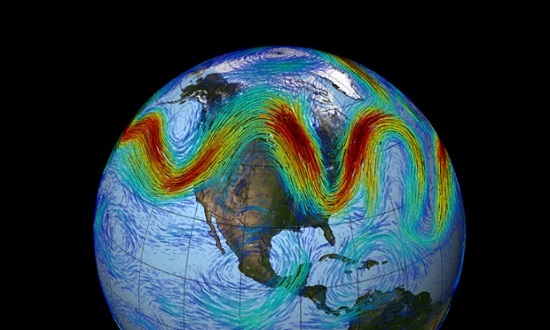
The Arctic is warming faster than lower latitudes. The Jetstream velocity depends on temperature difference, hence it is slowing. It is also more wavy and has a tendency to get stuck, so heat or cold persists over a large area. Ironically, there is less storminess. Storms transport water onto land and break up persistent weather patterns.
The jet stream that circles Earth’s north pole travels west to east. But when the jet stream interacts with a Rossby wave, as shown here, the winds can wander far north and south.

5. Brisbane EV charging technology takes on the world
Brisbane-based electric vehicle infrastructure company, Tritium, has done a deal to supply its award-winning Veefil DC fast charging stations to America’s ChargePoint company. ChargePoint has 21,000 EV chargers around the US.
The Australian-made stations will be installed on major routes across the country, including the express charging corridors on both the east and west coasts of the US that are being built as part of a recent deal between ChargePoint, Volkswagen and BMW.
The 50kW Veefil stations – which in the US will be called DC Fast stations and will be ChargePoint branded – are able to deliver up to 80 miles or 128 kilometers of charge in just 20 minutes, thus removing one of the key barriers to EV uptake: range anxiety.


