Tag Archives: Emissions

Climate clippings 118

1. Growth in CO2 slows

Global carbon dioxide (CO2) emissions from fossil fuel use and cement production grew 2% in 2013 to the new record of 35.3 billion tonnes of CO2. This was about half the average for the last 10 years and less than global GDP growth of 3.1%.

2. Aradhna Tripati gets a gong

The Center for Biological Diversity presented its third annual E.O. Wilson Award for Outstanding Science in Biodiversity Conservation to Dr. Aradhna Tripati for her groundbreaking research on carbon dioxide’s role in climate change.

Tripati’s work revealed that the last time CO2 levels were as high as they are today was 15 million to 20 million years ago, when the distribution of plants and animals was dramatically different, global temperatures were 5 to 10 degrees warmer, and the sea level was 75 to 120 feet higher than today. Her research suggests that the CO2 threshold for maintaining year-round Arctic ice may be well below modern levels.

Converting from Fahrenheit to Celsius and feet to metres that would make 2.7 to 5.5°C and 23 to 36 metres.

I would caution that the shape of the ocean basins may have been different, but these are alarming findings.

3. 1000-year drought history of Queensland and New South Wales

By analysing ice cores Australian scientist have found that there were eight droughts in the last millennium that lasted more than five years, with one of the so-called mega droughts lasting for almost 40 years. That was back in the 12th century.

This tends to indicate that the Millennium Drought and the Big Dry from 1997 to 2009 were not unusual.

From the official news release:

Explaining the findings, Dr Vance said the ice core analysis had significantly enhanced our understanding of a relatively poorly understood phenomenon known as the Interdecadal Pacific Oscillation (IPO).

The IPO describes a roughly 25-year cycle in the sea surface temperature, wind and other factors in the Pacific Ocean.

The IPO’s positive phase is closely linked with longer and more severe droughts in the United States and Australia. The risk of droughts occurring in Australia is higher during the IPO’s positive phase.

I’m not questioning the findings but how drought in Queensland and NSW can be derived from drilling ice cores in the Antarctic is not immediately obvious.

Where does this leaves global warming? The authors don’t say, but the clear implication is that severe droughts are part of the natural cycle. Warming is a given. The most recent analysis I recall is that drying along the southern edge of the continent has a climate change component. North of the Victorian border there is uncertainty.

4. Lifters or leaners?

Or backmarkers. UK PM David Cameron thinks Australia does not want to be a “backmarker” on climate change action. Global pressure will make us do more. Has he met our Tones?

Christian Downie thinks the real achievement of the Lima climate talks

wasn’t the goals set, but the fact that international talks like these make it increasingly hard for breakaway countries to ignore the issue.

John Kerry spells it out:

“If you are a big developed nation and you do not lead, you are part of the problem.”

Part of the problem indeed, and perhaps an active climate change vandal. Kieran Cooke reports that in Lima Australia was “lobbying for rules that undermine the integrity of the emissions accounting system”.

5. Antarctic sea ice

One of the conundrums of climate science has been the question of why the Antarctic sea ice has been expanding. Eric Steig at RealClimate takes a detailed look. One of the complexities is that the sea ice is expanding in some places and contracting in others. This, he says, rules out simplistic notions like an increase in westerly winds.

However, if you take into account the changes in all the wind patterns in the Antarctic you get a better match, indeed a good match.

Finally Steig says:

Not incidentally, changing winds also have a lot to do with what’s been happening to the Antarctic ice sheet (meaning the land-based glaciers, distinct from the sea ice). I’ll have another post on that later this month, or in the New Year.

Climate clippings 94

Climate clippings_175

1. CO2 concentrations passing 400 ppm

Each year the atmospheric concentrations measured at Mauna Loa Observatory in Hawaii surge as spring turns into summer. We are now at the point where earlier each year they surge past 400 ppm, this year as early as March. By 2016 they will probably remain permanently above 400 ppm.

Dr Pep Canadell says crossing the 400 parts per million threshold will make it more difficult and expensive to limit climate change to two degrees.

The second part of this century we need to reduce emissions to zero and on top of it, to be removing carbon dioxide from the atmosphere so that by the end of 2100, we can stay stable under two degrees.

Canadell is head of the Global Carbon Project at the CSIRO.

2. Bio-energy with Carbon Capture & Storage

Speaking of sucking CO2 out of the atmosphere, bio-CCS is the new buzz word (I’ve also seen BECCS). The Climate Institute has released a report by Jacobs SKM Moving Below Zero: Understanding Bio-energy with Carbon Capture & Storage . Their modelling finds that

bio-energy with carbon capture and storage, or bio-CCS using food wastes, sustainable forest biomass, or crop residues, has the potential to contribute significantly to climate change efforts in Australia.

This process could remove and displace about 63 million tonnes of CO2 equivalent (MtCO2-e) annually by 2050, around 1.5 times current emissions from all cars in Australia. As well it would generate 12% of the country’s electricity.

Globally the process could remove up to 10 billion tonnes of pollution per year by 2050, according to the International Energy Agency.

The report may be downloaded from this page (scroll down). Go here for an interview with Malte Meinshausen.

3. Are coal miners responsible for greenhouse gas emissions?

No, said the Queensland Land Court in its judgement on the giant Alpha coal mine project which would dig up about 30 million tonnes of coal a year from the state’s Galilee Basin.

That’s the central fact in Graham Readfearn’s interesting story about what’s un-Australian.

Burning Alpha coal would generate 1.8 billion tonnes of CO2 over 30 years. That’s more than three times Australia’s annual emissions.

4. Abbott calls climate concerns “clutter”

In the lead up to the G20 meeting in Sydney in February, Abbott said

he didn’t want to “clutter up the G20 agenda with every worthy and important cause, because if we do, we will squander the opportunity to make a difference in the vital area of economic growth.”

The post, correctly, I think, sees Abbott as rolling back environmental and climate initiatives as hostile to economic growth, relying for economic impetus on the fossil fuel industry.

Heather Zichal, until recently President Obama’s lead climate and energy adviser, thinks otherwise:

Zichal suggests that focusing on economic productivity could be the sweet spot that Australia could use to balance climate concerns and economic growth goals. Reducing pollution and emissions from power plants and imposing strong energy efficiency measures on transport and infrastructure can boost energy productivity, save money, create jobs, and reduce emissions. “Ultimately, across all economic sectors, energy productivity is the most reliable, cleanest, and cheapest resource,” Zichal said.

Countries have to front up with their revised mitigation plans by April next year ahead of the Paris UNFCCC conference in December, hence leaving climate off the G20 agenda is simply not an option. Abbott has been told, by Christine Lagarde, managing director of the International Monetary Fund, and other powerful players.

One wonders what we will front up with next April. I predict nothing that would make a difference. We’ll see what others are doing and then do as little as possible.

5. Direst Action is a figleaf

Clive Palmer has spotted the figleaf and plans to pluck it away, says Ben Eltham. The Direct Action funding may be part of the budget, which Labor will not vote down. The Government needs no further legislation to enable expenditure, but Abbott can’t get rid of the dreaded carbon ‘tax’ without legislation. When he comes to negotiate that with PUP Direct Action will be on the table.

Eltham is right on the demographics:

While this [having no climate policy in place] may not unduly trouble the climate sceptics on the Coalition backbench, it also removes the chief utility of Direct Action, which is political, rather than environmental. Direct Action has always been used by the Coalition as a handy tool to deflect unwelcome scrutiny of its profoundly anti-environment attitudes. Without it, the Government will find it increasingly difficult to defend itself against charges of destroying the planet.

In the last Nielsen poll the 55+ group was the only one where Abbott had a clear lead, with LNP/Labor/Green at 49/33/10. This should be causing concern for the future of the conservative parties. For the young it was 32/36/26.

6. Direct Action is not scalable

Lenore Taylor points out that while Direct Action may or may not achieve 5% reductions in emissions by 2020, (most experts say, no) the policy is not scalable when the world gets a bit more serious about climate change mitigation.

according to the available modelling, even if Australia spent $88bn from 2014 to 2050 on Direct Action-type policies, emissions would still rise by around 45%. Most economists conclude that big emissions reductions under Direct Action are just not possible.

7. Green groups to use legal strategies

Given the above and the LNP’s farcical attitude to the Renewal Energy Target Review, green groups see lobbying as a waste of time and are increasingly planning legal challenges.

The Australian Conservation Foundation will be targeting voters in marginal electorates to encourage MPs to take climate change seriously. The aim is to change the current race to the bottom to a race to the top.

Reminder: Use this thread as an open thread on climate change.

Simple graphs tell a big story

John D drew my attention to RenewEconomy’s Graph of the Day: Nine simple charts to explain the global carbon budget. The post was originally published at Shrink That Footprint. There’s been next to no discussion at either place, but in my experience site stats show that a lack of comments doesn’t necessarily mean a lack of readers.

The graphs all come from the Global Carbon Project’s Carbon Budget 2013, which you can download here.

Here’s my version of the story in eight slides.

Please note that CO2 emissions are quoted as gigatonnes of carbon. Each GtC = 3.664 GtCO2.

1. Carbon emissions are still rising

In 2012-13 carbon emissions from fossil fuels and cement rose by 2.1% as against 2.2% in 2011-12.

Picture1_cropped_500

2. Emissions from coal continue to grow strongly

Emissions from coal grew at 2.8% as against gas and cement at 2.5% and oil at 1.2%.

Picture2_cropped_550

Shares of fossil fuel emissions are now coal 43%, oil 33%, gas 18% and cement 5%. Flaring at 1% is not shown. Continue reading Simple graphs tell a big story

Climate clippings 82

I’m not planning to do posts on the upcoming election apart from link posts if I see anything interesting and/or important. The post on the Murdoch’s intervention started out as a link post, but then I warmed to the task. While this space is open I’d like to explore a theme that came from a comment in reaction to the LNP ‘solution’ to the asylum seeker ‘problem’. I can’t find it now, but someone asked, “What have we become?”

Moreover, what will we become? We have a choice, and in our response to the stranger in need who has chosen us, we either grow or diminish ourselves.

The task is ambitious and I’m not academically equipped for it. I’m not speaking as a philosopher or a sociologist, just “someone who is trying to sort out his ideas”, so the results may be modest. Some of the posts may not appear to be directly on the topic, but I hope all will fit together in the long run.

Climate clippings_175Meanwhile I’ll try to keep some information flowing on climate change. Both these projects may be of more use than any contribution I can make to an election here in Oz. This time CC will be free flow rather than numbered items, to save time. I’ll use bold to identify the topics.
Arctic ice is losing its reflective sheen. We all know that ice reflects more incoming radiation from the sun than does open water. Now by analysing 30 years of satellite data scientists have found that albedo of the ice itself at the end of the summer is about 15% weaker today than it was 30 years ago.

The cause of the darkening is

partly due to thinning ice and the formation of open water fissures, and partly because in the warmer air, ponds of liquid water form on the surface of the ice. The shallow ponds on the ice can dramatically reduce reflectivity and increase the amount of solar radiation that the ice absorbs.

Continue reading Climate clippings 82

CO2 hits 400 ppm

On May 9 CO2 reached 400 ppm at the National Oceanic and Atmospheric Administration’s (NOAA) monitoring centre at Muana Loa and at at the Scripps Institution of Oceanography in San Diego, California. This is what’s been happening over the last 130 years in broad terms:

co2-temp_570

It seems many news organisations, for example the BBC, and some scientists are stressing that the last time concentrations were so high was 3 to 5 million years ago. In the linked article Michael Mann, director of the Earth System Science Center at Penn State gives a different view:

Mann said the last time scientists are confident that CO2 was sustained at the current levels was more than 10 million years ago, during the middle of the Miocene Period. Continue reading CO2 hits 400 ppm

National greenhouse emissions accounts

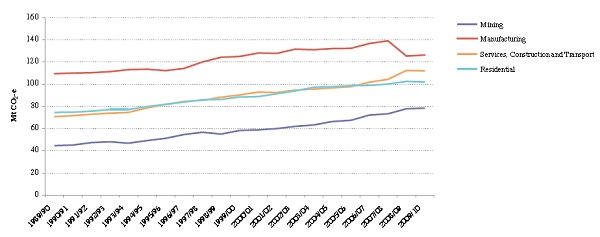
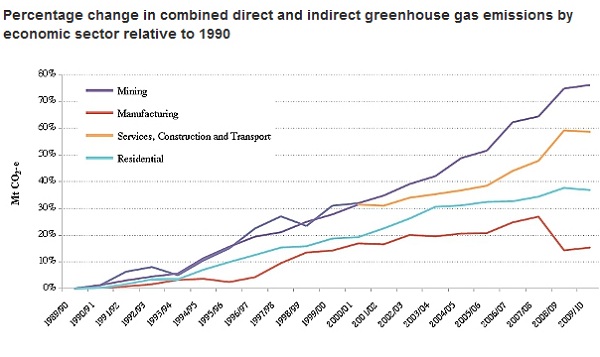
Tristan Edis at Climate Spectator makes a valid point that insufficient attention has been given to the increase in mining emissions in our national inventory.

The two graphs displayed represent change in emissions. To provide context we really need to know the total quantum of emissions for each category. So I looked for the source of his graphs.

Turns out there is no one source. You have to go to this page. There is also a search facility here.

Edis has chosen his graphs well to make the points he makes, but some of the impressions may be misleading. Mining is the fastest growing sector but agriculture, residential and manufacturing are all still larger sectors. And residential in his graphs is only about half electricity consumption. The other half is mostly transport, but also includes emissions generated at residences, presumably mainly from gas. There are many messages you can dig out of the mine of information provided online. I’ll try to give a brief overview here.

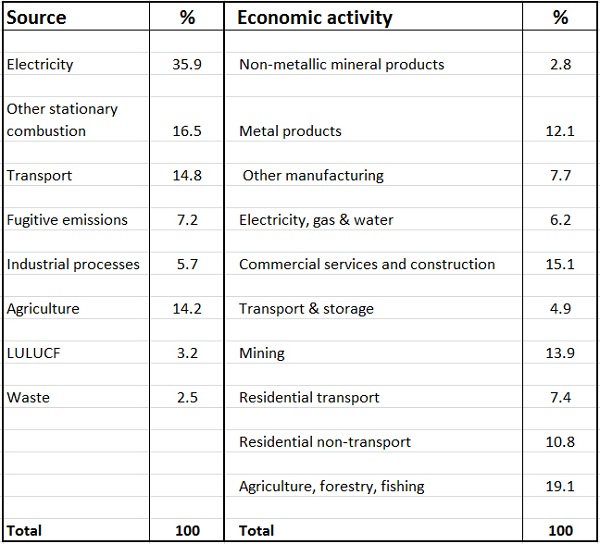
This table, from the National Inventory by Economic Sector 2009/10 gives a snapshot of Australia’s direct emissions, that is from the point they are generated:

Direct emissions

Land use, land use change and forestry (LULUCF) activities are included.

The figure for electricity needs to be largely distributed across the other sectors. For example, the residential figure cited here would comprise only transport plus other emissions generated at homes.

Edis’s first graph is Figure 6 in the Quarterly Update of Australia’s National Greenhouse Gas Inventory: December 2011. I’ll skip it and go to his second graph, which is Figure 7 of National Inventory by Economic Sector 2009/10:

Percentage change in direct and indirect emissions

The MtCO2e on the y-axis should have been omitted. Use of grid electricity is included in each sector. Agriculture is left out. It really should have been accompanied by Figure 6:

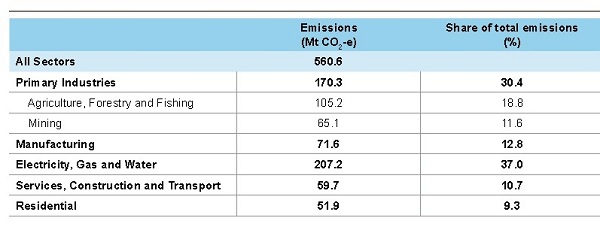
The graph that best captures everything happening now (at least in 2002-2010) is Figure 8 from the same document (p20). The graph is too big to reproduce here, so I’ve made this table:

Some thoughts.

Given the size of the electricity sector as a source and its potential in reducing emissions in the transport sector, clearly decarbonising electricity generation would go almost half way towards achieving zero emissions. Tackling electricity generation and transport represent the low-hanging fruit.

We have to ask whether an emissions trading system (ETS) by itself will achieve this in a time frame compatible with avoiding dangerous climate change. Recently I heard on Radio National that the fall in the demand for electricity is effectively locking in coal as a source of baseload power. If this article is correct we are spending $100 billion on a grid which will not be capable of handling diversified power generation.

This article is one of many detailing the falling electricity demand and some of the implications.

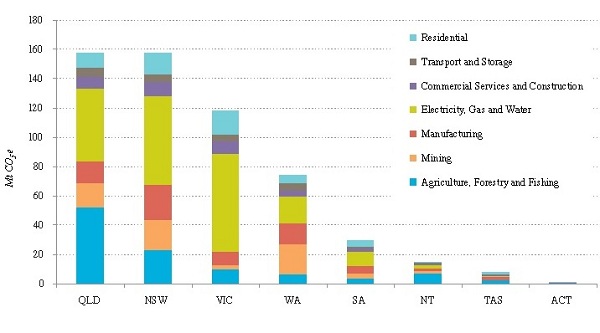
From the National Inventory by Economic Sector document, Figure 3 gives the direct emissions for each state:

Queensland would be the champion in per capita terms.

The Queensland LNP Government has decided to axe the policy and programs section of the Office of Climate Change. ‘Can-do’ can do whatever he wants!

Climate clippings 66

New solar PV nanotechnology

There have been so many developments in PV technology it’s hard to know which will be significant.

Gizmag tells us about new material consisting of tiny hollow spheres, made out of nanocrystalline-silicon.

The new material is efficient, light, flexible, should be easy and cheap to make and their efficiency is less affected by the angle of the sun.

No downsides are mentioned. Continue reading Climate clippings 66

Climate clippings 63

China report on climate change

China's economicChina's advance will be hampered by climate change, a government report finds

(Photo from Reuters, via The Age.)

From Reuters we hear about the Second National Assessment Report on Climate Change which sums up advancing scientific knowledge about the consequences and costs of global warming for China:

Global warming fed by greenhouse gases from industry, transport and shifting land-use poses a long-term threat to China’s prosperity, health and food output, says the report.

In 2010 China’s emissions grew by 10.4%. This rate is expected to slow, but for reductions we will have to wait until about 2030, “with big falls only after mid-century”.

Here’s the Executive Summary. Continue reading Climate clippings 63

Climate clippings 61

David Archer on methane

Arctic methane plumes

Climate clippings 58 led with an item on Methane worries. @ 18 I identified David Archer as one who is “very knowledgeable on the matter [and] thinks the process will be chronic rather than catastrophic.” Continue reading Climate clippings 61

Climate clippings 58

Methane worries

A team of Russian research scientists have been surveying the seabed of the East Siberian Arctic Shelf off northern Russia for nearly 20 years.

In an exclusive interview with The Independent, Igor Semiletov, of the Far Eastern branch of the Russian Academy of Sciences, said that he has never before witnessed the scale and force of the methane being released from beneath the Arctic seabed.

“Earlier we found torch-like structures like this but they were only tens of metres in diameter. This is the first time that we’ve found continuous, powerful and impressive seeping structures, more than 1,000 metres in diameter. It’s amazing,” Dr Semiletov said. “I was most impressed by the sheer scale and high density of the plumes. Over a relatively small area we found more than 100, but over a wider area there should be thousands of them.”

I realise this has been linked to three times in the previous thread, but it’s important and not everyone reads the comments threads.

A separate study has found that the methane stored in permafrost is three times larger than earlier estimates. It could release 1.7-5.2 times more carbon than previously thought, depending how rapidly the world warms.

In a cautionary note here, James Hansen reckons we are forcing the system 20,000 times faster than commonly happened through natural caused in the past 50 million years. Continue reading Climate clippings 58

Climate clippings 57

WMO on the 2011 climate

Via Climate Progress we have the WMO’s Provisional Statement on the Status of the Global Climate and press release. This graph is interesting:

Temperatures relative to 1960-1990

2011 is shaping as the 10th highest on record and are higher than any previous year with a La Niña event. The 13 warmest years have all occurred in the 15 years since 1997. WMO Secretary-General Michel Jarraud:

“Concentrations of greenhouse gases in the atmosphere have reached new highs. They are very rapidly approaching levels consistent with a 2-2.4 degree Centigrade rise in average global temperatures which scientists believe could trigger far reaching and irreversible changes in our Earth, biosphere and oceans,” he said.

Continue reading Climate clippings 57

Climate clippings 56

Energy from biomass

A new report suggests that we should be able to feed a growing population, conserve the environment and produce 20% of world energy needs from biomass by making “the best use of agricultural residues, energy crops and waste materials”.

The report by the UK Energy Research Centre (UKERC) can be downloaded from here.

I’m not sure how well they took into account the impact of climate change on agricultural productivity. They did consider an IPCC report on renewable energy (large pdf) and a study by the German Advisory Council on Climate Change (WBGU). Of the latter they said:

The WGBU08 report is arguably the most comprehensive study of the implications of growing bio-energy crops considered here. The approach uses a spatially explicit yield model for terrestrial productivity (LPjmL) driven by IPCC climate models, and scenarios. (p. 35)

You would need to go back to those studies to see what changes of weather, melting glaciers, sea penetration of river deltas etc were taken into account. Continue reading Climate clippings 56