Tag Archives: Antarctica

Climate clippings 98

This edition includes important updates on Greenland and Antarctica, global food supply, CSIRO cuts, CO2 levels moving decisively past 400 ppm and CO2 compared to global temperature rise.

1. Greenland may melt faster than expected

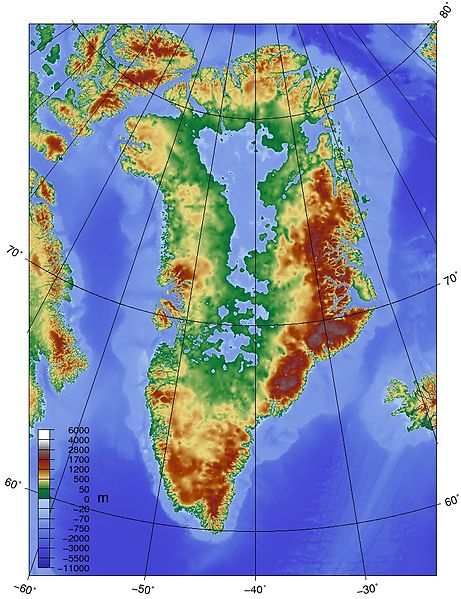
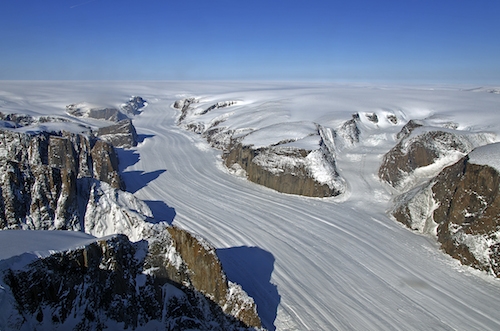
You may recall from the post Arctic images I included an image of the underlying topography of Greenland (Figure 5). It is saucer-like with large areas inland below sea level. The glaciers tend to drain through narrow gateways in the external rim. So they tend to be narrow and fast-flowing:
Glacier_assets-climatecentral-org-images-uploads-news-5_16_14_Andrea_Greenlandglacier-500x331

The mouths of most glaciers are melting from contact with warmer seas. It was felt that as this process continued the ice would lose contact with the water, slowing the melting.

New studies of the topography have shown that many of these channels are below sea level.

Valleys underlying many of the glaciers stay below sea level and extend much farther inland than previously suggested, so warm ocean currents that have migrated northward with the changing climate could eat away at the ice for much longer than current climate models suggest. “It will take much longer for these glaciers to lose contact with the ocean,” study author Mathieu Morlighem, of the University of California, Irvine, told Climate Central.

2. Melting Antarctica could devastate global food supply

A new report is the “first to factor in the effects of the slow-motion collapse of the Western Antarctica ice sheet on future food security.”

About time, I’d say.

The report acknowledges recent findings that that the retreat of the Western Antarctica ice sheet was unstoppable – and could lead to sea-level rise of up to 4 metres over the coming centuries.

“That sea-level rise would take out half of Bangladesh and mostly wipe out productive rice regions in Vietnam,” Nelson told The Guardian. “It would have a major effect on Egyptian agricultural areas.”

“A sea level rise of 3 meters (10 feet) over the next 100 years is much more likely than the IPCC thought possible,” the report said.

In terms of absolute land loss, China would be at risk of losing more than 3 million hectares (7.4 million acres). Vietnam, India, Bangladesh, and Myanmar could lose more than 1 million hectares (2.5 million acres), the report said.

The report recommends a radical increase in expenditure on agricultural research, which has been in decline everywhere over recent decades.

3. CSIRO cuts

The federal government cut CSIRO’s funding by $111 million over four years, which will result in 500 job cuts.

Dr Borgas [president of the CSIRO Staff Association] said a plan to move the Aspendale Laboratories to the organisation’s larger site in Clayton had been previously discussed but had come to nothing.

He said it was unclear whether the relocation would reduce the research performed by the 130 staff, which includes ice core analysis, air quality and pollution research and climate and atmospheric modelling.

Most countries planning for a future increase their scientific research funding.

4. CO2 levels decisively pass 400 ppm

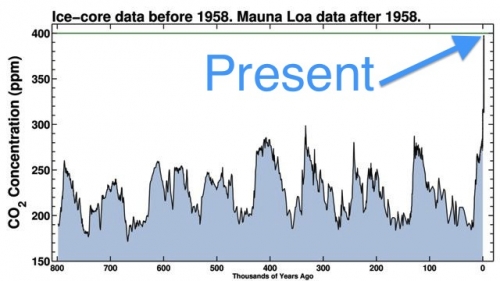
During April all 12 World Meteorological Organisation northern hemisphere monitoring stations passed the 400 ppm mark, the first time ever. This is how such a level compares to the 800,000 year ice core record:
assets-climatecentral-org-images-uploads-news-5_2_13_news_andrew_co2800000yrs-500x282

When was it last this high? Possibly 15 million years ago, when it was warmer and there wasn’t much ice around.

“This was a time when global temperatures were substantially warmer than today, and there was very little ice around anywhere on the planet. And so sea level was considerably higher — around 100 feet [30 metres] higher — than it is today,” said Pennsylvania State University climate scientist Michael Mann, in an email conversation. “It is for this reason that some climate scientists, like James Hansen, have argued that even current-day CO2 levels are too high. There is the possibility that we’ve already breached the threshold of truly dangerous human influence on our climate and planet.”

5. Global temperature and CO2

I came across this graph from the NOAA National Climatic Data Center plotting CO2 levels against temperature rise. While correlation does not mean causation there is simply no alternative explanation.

assets-climatecentral-org-images-uploads-gallery-TVM-Global_Temp_and_CO2_web-600

If you take out 1998, which can be regarded as an outlier, the socalled ‘pause’ is only apparent from 2005, which is too short a time to mean anything.

There is another view which sees temperature responding in step-wise fashion. On that basis we may be due for another step, and with an El Niño likely…

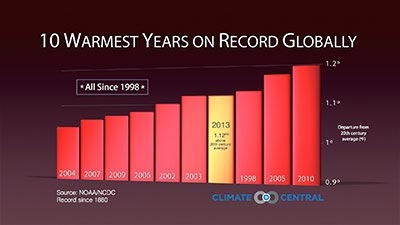
Here’s one showing the ten warmest years on record, all since 1998:
assets-climatecentral-org-images-uploads-gallery-climate-matters-GlobalRecapRanking_sm-400x225

Reminder: Use this thread as an open thread on climate change.

Antarctic images

In this post I’ve included a series of explanatory images of the Antarctic in order to assist understanding the peril we are in from changes there, and why the Antarctic is going to be central to the climate change story over the coming centuries. What happens to the grandchildren of those who are children now is the big concern. In large part these images relate to items 2-4 of Climate clippings 96.

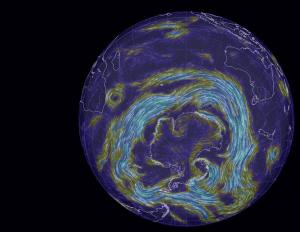
The first shows the giant vortex of winds, the strongest for at least 1000 years, ripping around Antarctica in a tight circle:

Figure 1
Figure 1

These winds draw rain away from southern Australia, and isolate Antarctica to some extent in terms of atmospheric warming. But they also churn up the ocean, leading to deeper mixing of heat and greenhouse gases.

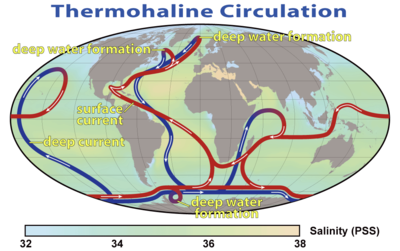
Both the deep and the shallow formations of the thermohaline circulation system wrap themselves around the Antarctic:

Figure 2
Figure 2

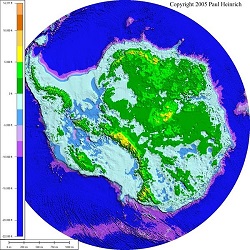
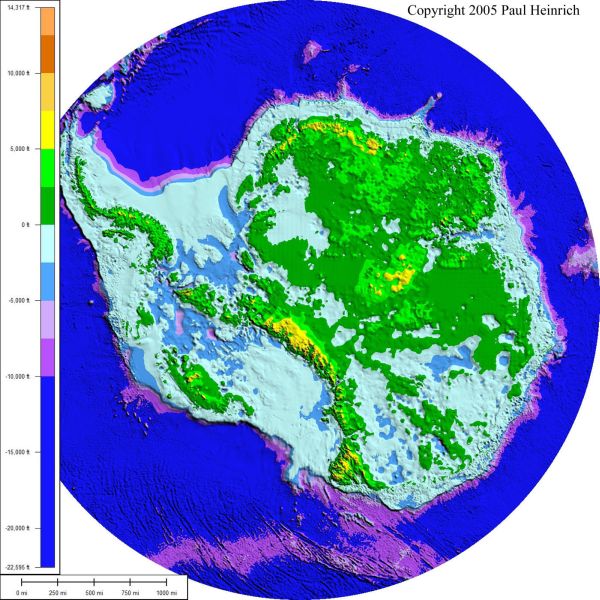
One way or another warm water is penetrating through to Antarctica. The underlying topography of Antarctica reveals much of the land lying below sea level:

Figure 3
Figure 3

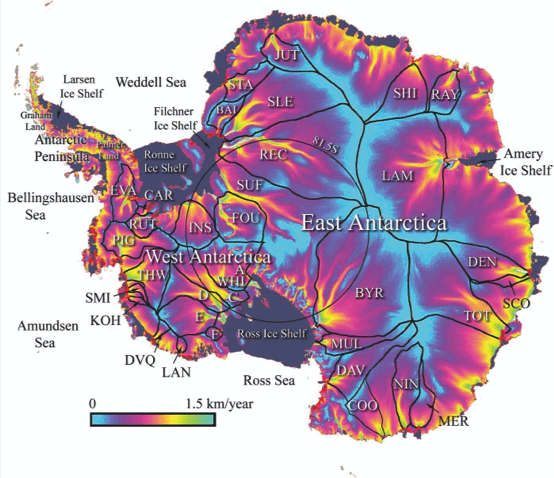
The borderline between blue and green marks sea level. Warmer water is coming directly into contact with the ice sheet and chewing away at the bottom of the ice shelves which form plugs holding up vast quantities of ice in the glaciers stretching hundreds of kilometres inland. The following image shows how the continent drains:

Figure 4
Figure 4

There is concern now that West Antarctica has tipped and with East Antarctica also more vulnerable than previously thought, sea level rise of some metres is now inevitable even if we were to somehow instantly curb greenhouse emissions.

Greenland is quite a different problem. For starters the underlying topography is saucer shaped, with glaciers exiting to the sea through ‘gates’. This image shows the topography:

Figure 5
Figure 5

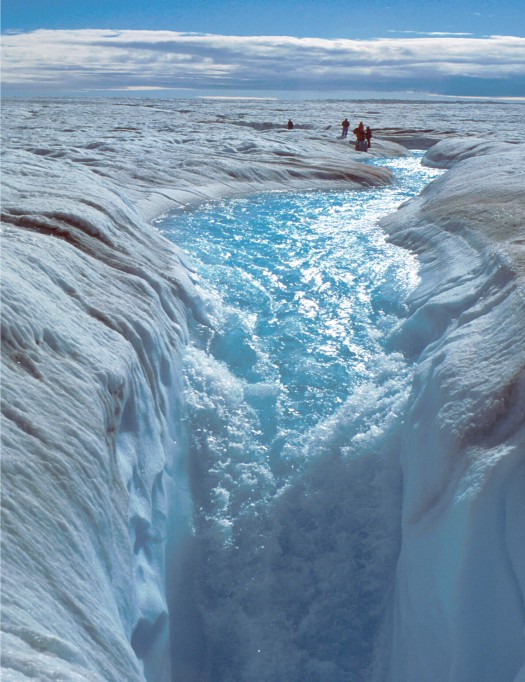
Greenland melts very much from the surface, so its largely a matter of meltwater penetrating, indeed plunging at times, through the surface to the rock below and glaciers speeding up. This image shows some people standing where I’d never stand:

Figure 6
Figure 6

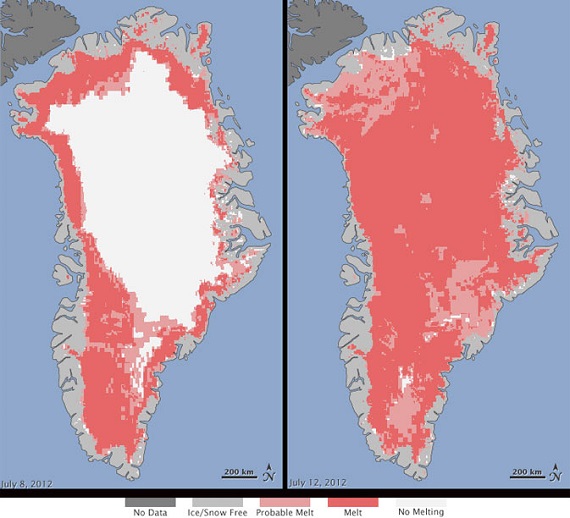
This image shows melting covering the entire Greenland ice sheet for a few days in 2012:

Figure 7
Figure 7

The panel on the left shows a more typical summer melt pattern, which is advancing noticeably over short time frames of a few years.

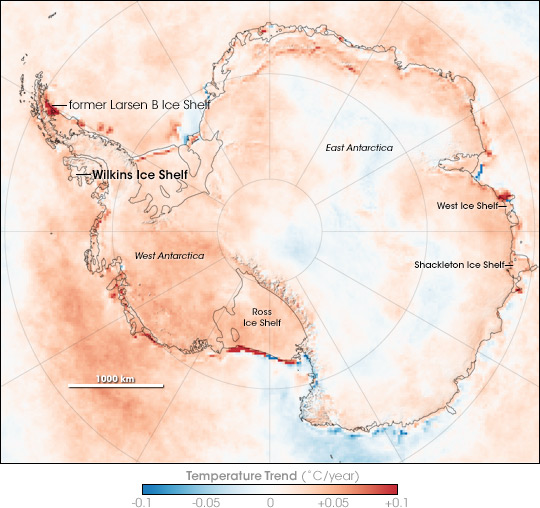
In the Antarctic, this image shows surface warming over the period 1981-2007:

Figure 8
Figure 8

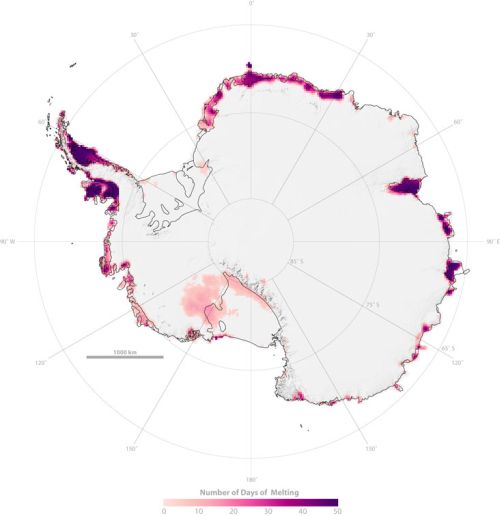
But with the average temperature around -39°C on the East Antarctic ice sheet, which is four kilometres high, that huge lump of ice is relatively stable. This image from NASA in 2005 shows significant perimeter surface melting around East Antarctica:

Figure 9
Figure 9

The new research sees concern that warmer sea waters may destabilise the ice further inland than previously thought. Match the red blobs on East Antarctica with the drainage map at Figure 4.

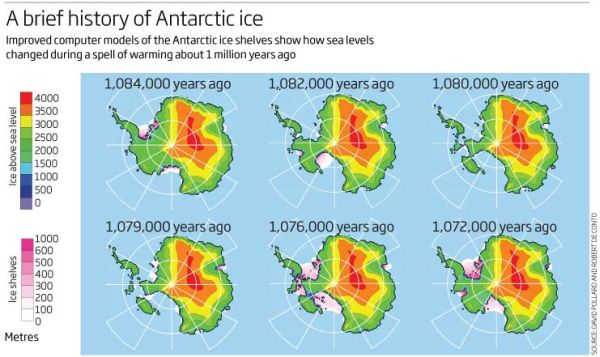
Of some some concern and some comfort is the Andrill Project which found that “the West Antarctic ice sheet has collapsed and regrown over 60 times in the past few million years”. This image shows what happened about a million years ago over a 12,000 year period:

Figure 10
Figure 10

Concern because the Andrill research shows what can happen with mild orbital forcing (the Milankovitch cycles) as the main driver. I understand that CO2 concentration back then was only 400 to 450 ppm, which is where we now, implying that we are already committed to wasting the West Antarctica ice sheet. There is some comfort, however, that a change in the orbital forcing, which is far weaker than what we are doing now, arrested the melt in West Antarctica and brought the ice sheet back again. There was no tipping point which saw the whole East Antarctic sheet disappear.

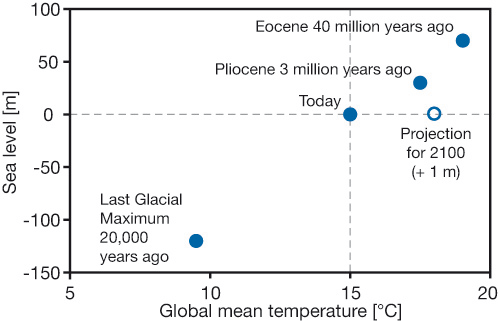
For perspective I’ll post one of my favourites, a graph from David Archer in 2006 showing the broad relationship between temperature and sea level:

Figure 11
Figure 11

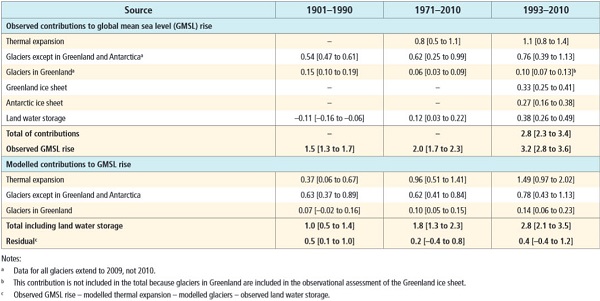
Do not connect the dots with straight lines. Most importantly, I think we now stand at the upper level of a 2°C interval where the sea level did not change much. The NH continental ice sheets had disappeared and the remaining ones – Antarctica, Greenland and the Arctic – were not seriously in play. Even now the main sources of sea level rise lie elsewhere. This table (13.1 from the IPCC5 WG1 Technical Summary) shows what’s happening:

Figure 12
Figure 12

That’s hard to read, so here are the figures for the average annual expansion for 1993-2010:

    Thermal expansion – 1.1mm

    Glaciers except Greenland and Antarctica – 0.76mm

    Glaciers in Greenland – 0.10mm

    Greenland ice sheet – 0.33mm

    Antarctic ice sheet – 0.27mm

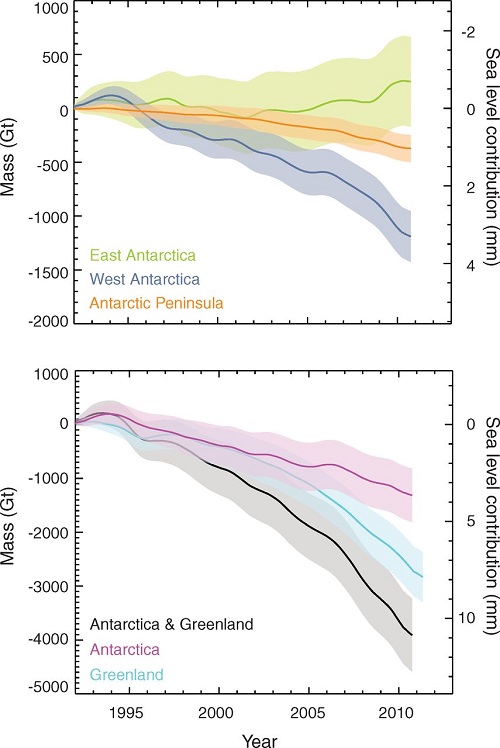
With 4-5°C we can expect complete deglaciation and 75 to 80m sea level rise, made up of East Antarctica 59m, Greenland 6-7m, West Antarctica 5-6m, other glaciers and ice caps about 0.5m and thermal expansion, I don’t know, but I think in single figures. Greenland and Antarctica are accelerating rapidly and some time this century will become the top two contributors. These graphs from Skeptical Science are instructive:

Figure 13
Figure 13

Greenland and West Antarctica are in a death spiral of accelerating ice sheet decay. It’s happened 60 or more time before in recent paleo history. West Antarctica, being more vulnerable may overtake Greenland.

One could say from this that East Antarctica is not yet in play, but science seems to suggest it is not far away.

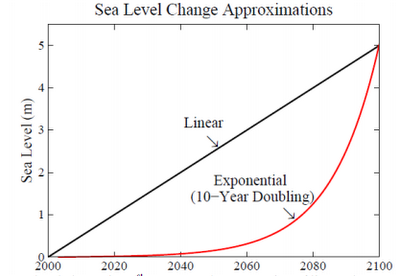
When ice sheet decay gets going Hansen sees it as possibly progressing in geometric fashion, producing a curve like this:

Figure 14
Figure 14

My thinking is that East Antarctica will tip sometime in the next decade, and that ice sheets will decay from there in a pattern that is more exponential than linear. Hansen’s scenario, which he puts forward as a serious possibility, does not look crazy.

I suspect that we are already committed to double digit sea level rise, and there’s not a thing we can do to prevent it; the question is when will it happen? We can only adapt and minimise.

I suspect also that things will go seriously pear-shaped during the latter part of this century. Pity our grandchildren’s grandchildren.

Update: There is a short ABC video news item about the Antarctic ice melt doubling since the last survey. At the end it says the process could take 1000 years. For a complete melt that would be lightning fast – 7.5 to 8 metres per century, or a metre every 12-13 years. We are pushing the system more than 10 times faster than it has ever been pushed before.

See also Gareth Renownden Goodbye coastline: we are beyond the point of no return.

Climate clippings 96

Climate clippings_175 This edition looks at changes in the cryosphere, a major US report, the prospects for an El Niño and the problem of China burning coal.

1. Pacific Ocean hot spot

Scientists have discovered a hot spot in the Pacific Ocean which is partly responsible for global warming in the Arctic. Incredibly this hot spot is east of Papua New Guinea.

This phenomenon is attributed to natural variations rather than global warming. Therein, perhaps, lies the reason that scientists have been constantly surprised by the rapidity of the Arctic sea ice loss.

2. Southern Ocean winds strengthening and moving south

Scientists have confirmed in a study covering the last 1000 years that winds are strengthening in the Southern Ocean and moving south. They found a definite trend greater than can be explained by natural variability and attributable to the effect of increased greenhouse gases.

Hence the drying of southern Australia is expected to continue. Also the tightening of winds around Antarctica inhibits warming of the continent. Nevertheless the warming of West Antarctica is considerable.

3. Antarctic glaciers melting past point of no return

A group of melting glaciers in West Antarctica appears to have reached the point of no return according to scientists from NASA and the University of California Irvine. Even if we cut back greenhouse gas emissions savagely now the melting will continue. We are probably looking at 3 to 5 metres of sea level rise, from Antarctica alone – that is our gift to future generations. Dangerous climate change is no longer just a future possibility, it’s happening now!

The question is, how long will it take? Here there is uncertainty. It could be as short as two centuries or as long as nine. Professor Eric Rignot thinks two centuries is “not outrageous”.

4. East Antarctica more vulnerable than thought

Part of East Antarctica is more vulnerable than expected to a thaw that could trigger an unstoppable slide of ice into the ocean and raise world sea levels for thousands of years, a study showed on Sunday.

The Wilkes Basin in East Antarctica, stretching more than 1,000 km (600 miles) inland, has enough ice to raise sea levels by 3 to 4 meters (10-13 feet) if it were to melt as an effect of global warming, the report said.

The Wilkes is vulnerable because it is held in place by a small rim of ice, resting on bedrock below sea level by the coast of the frozen continent. That “ice plug” might melt away in coming centuries if ocean waters warm up.

“East Antarctica’s Wilkes Basin is like a bottle on a slant. Once uncorked, it empties out,” Matthias Mengel of the Potsdam Institute for Climate Impact Research, lead author of the study in the journal Nature Climate Change, said in a statement.

Wilkes basin could be more vulnerable than West Antarctica, but perhaps on longer time scales. Again there is concern with tipping points. James Hansen famously said, You can’t sling a rope around an ice sheet!

5. Climate change is clear and present danger, says landmark US report

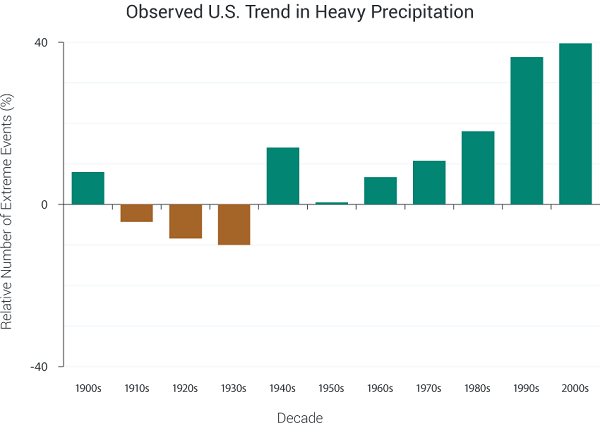
Climate change is already severely impacting US economy, ecology and health, according to the the third National Climate Assessment report. Arid areas will become dryer, moist areas wetter and wildfires and storms will become more frequent and severe. For example floods have increased in frequency, mainly in the Midwest and Northeast:

CS_extreme-precip-index_13263_V9_600

From The Guardian:

Climate change has moved from distant threat to present-day danger and no American will be left unscathed, according to a landmark report due to be unveiled on Tuesday.

The National Climate Assessment, a 1,300-page report compiled by 300 leading scientists and experts, is meant to be the definitive account of the effects of climate change on the US. It will be formally released at a White House event and is expected to drive the remaining two years of Barack Obama’s environmental agenda.

The findings are expected to guide Obama as he rolls out the next and most ambitious phase of his climate change plan in June – a proposal to cut emissions from the current generation of power plants, America’s largest single source of carbon pollution.

Joe Romm at Climate Progress has more, while Emily Atkin looks at the impact on indigenous groups in Alaska and Pacific Islands.

6. Chances of El Niño almost 4 out of 5

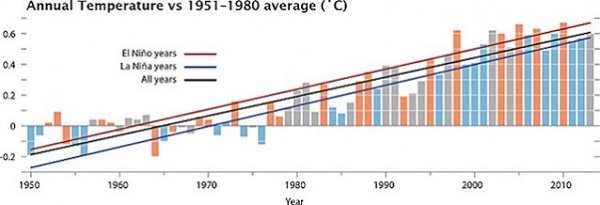
The chances of an El Niño developing this year are now at almost 80% according to some estimates. This graph shows the increased temperature in El Niño years.

gistemp_nino_s-600

It could be a warm one.

Parts of the western United States suffering chronic drought could have flooding rains. In Oz where large areas are in drought, there would be even less chance of relief.

7. China, please stop using coal!

China should put a cap on greenhouse gas emissions from coal by 2020, and then swiftly reduce its dependency on the fossil fuel, according to a new study. Otherwise climate change will be impossible to stop.

Of relevance, back in 2011 the IEA said that after 2017 any new fossil fuel power generation should be matched by the decommissioning of equivalent existing capacity.

Reminder: Use this thread as an open thread on climate change.
Climate clippings 90

Climate clippings_175These posts are intended to share information and ideas about climate change and hence act as a roundtable for readers to contribute items of interest. Again, I do not want to spend time in comments rehashing whether human activity causes climate change.
This edition begins with a couple of items on extreme weather, but is mainly about solar electricity. Once again, thanks to John D for providing some links.

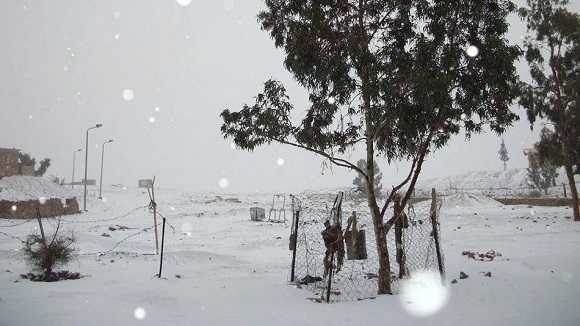
1. Snow in Egypt

Recently snow fell across the Middle East, with pictures from Egypt, Israel, Syria, The Lebanon and Iran.

EGYPT-WEATHER

Conditions in refugee camps in the area must be horrific. Flooding was general throughout the area, including Gaza.

See more photos of extreme weather.

Lest you think global warming has gone away, November 2013 was the globe’s warmest November since records began in 1880, and the 345th consecutive month with global temperatures warmer than the 20th century average. Continue reading Climate clippings 90

Climate clippings 83

Climate clippings_175These posts are intended to share information and ideas about climate change and hence act as an open thread. Again I do not want to spend time in comments rehashing whether human activity causes climate change.

This edition contains items, exclusively, I think, in climate science and impacts. The thread is meant to function also as a roundtable to share information and ideas.

1. Climate change picked the crops we eat today

The New Scientist carries a story about how some cereals we know today were changed by the climate as we came out of the last ice age. Researchers at the University of Sheffield, UK took seeds of precursors of modern wheat and barley found with human remains in a 23,000-year-old archaeological site in Israel. They grew these together with four wild grass species that aren’t eaten today, but were also known to grow in the region at that time, and grew them under conditions replicating levels of CO2 then and also the higher levels when farming first arose 10,000 years ago.

All the plants grew larger under the higher levels of CO2, but the relatives of wheat and barley grew twice as large and produced double the seeds. This suggests the species are especially sensitive to high levels of CO2, making them the best choice for cultivation after the last ice age.

The team plan to look at whether other food staples around the world are similarly affected by elevated CO2 levels, for example millet grown in Asia and maize in North America. They also plan to compare the effects of CO2 on legumes such as peas. Continue reading Climate clippings 83

Pine Island Glacier spawns a giant iceberg

As David Spratt posted at Climate Code Red a giant crack has opened across the full width of the Pine Island Glacier (PIG) ice shelf, spawning a new iceberg about 720 square kilometres in area, roughly eight times the size of Manhattan Island in New York. This is about the best photo I can find:

Pine Island Glacier_dn23847-1_450

We’ll get some orientation first and then look at the implications. This image locates the PIG on the continent of Antarctica:

AntarcMapPelto-300x255

This image from the LiveScience photo gallery outlines the PIG basin:

Pine Island Gl;acier_pi-3-PIG_map_Bodentopograpfie_beschriftet_w

This basin together with the Thwaites Basin just to the south drains 40% of West Antarctica. These two glaciers alone could lead to sea level rise of half a metre by 2100 according to material cited by Spratt. Continue reading Pine Island Glacier spawns a giant iceberg

Climate clippings 77

Climate clippings_175

1. Antarctic ice melt studies

A recent study by Abram et al showed that the ice on the Antarctic peninsula was melting about 10 times faster than it was 600 years ago, concluding that further melting was particularly sensitive to temperature increases. The headline and the text of this story perhaps gave the impression that the whole continent was ready to go.

A more sober assessment was found at The Carbon Brief where the study was linked with another study by Steig et al that finds recent changes in the West Antarctica ice sheet “cannot be distinguished from decadal variability that originates in the tropics.”

Nevertheless Antarctica overall is losing mass (see also here). Antarctica contributed strongly to sea level rise during the Eemian and the Andrill study showed that “the West Antarctic ice sheet has collapsed and regrown over 60 times in the past few million years”. Any complacency would be misplaced.

2. New review of ice sheet studies

The Carbon Brief has also posted on a new major review of the latest research on ice sheets. The last IPCC report (AR4) relied on about 10 years worth of reliable sea level data, from 1993 and 2003. Greenland and Antarctica together were found to be raising sea levels by about 0.42 mm per year. That has now doubled to about 0.82mm per year.

So while we are still dealing with short time periods, a clear acceleration is in evidence.

3. Skeptical bloopers

The Carbon Brief reckons that once about every six months David Rose runs an article saying global warming has stopped. Here’s their post of October 2012. Then they lined up six top rebuttals of the week, and a reader contributed a seventh by Tamino.

It’s a tired canard and I didn’t bother reading them all. It did introduce me to the Met Office News Blog which has, for example, a very clear post on tornadoes.

Elsewhere in case you missed it Andrew Glikson debunks the notion that CFCs are responsible for global warming.

4. Garnaut recommends 17% target

Dr Jenny Riesz of the University of NSW reports on Garnaut’s recommendation to the Climate Change Authority which is currently deliberating on the Caps and Targets Review. He favours a 17% target by 2020 to put us in line with the US, Canada and other major economies.

At the Cancun United Nations negotiations in 2010, President Obama committed the USA to an emissions reduction target of -17% by 2020 (below 2005 levels). This has been somewhat ignored in Australia’s carbon targets debate, because policy to implement a national carbon pricing scheme to achieve this target was filibustered by the US Senate.

However, the USA remains committed to this target, both in spirit, and in writing with the UNFCCC.

Canada has promised to match the USA.

He suggests that the EU has found it much easier to meet their targets than originally anticipated, which is a typical experience. This, he says, is in part why their carbon price has collapsed.

Garnaut points out that:

the biggest change of all is coming from China, in terms of quantity of emissions reduction from business as usual. They have set truly ambitious targets, and are meeting them through a wide range of activities, including substantial structural change in the Chinese economy. These actions are driven by a wide range of objectives, including environmental drivers, desire for expansion of the role of services in the economy, and desire for more equitable income distribution.

5. Carbon trading schemes

In the last CC thread Jumpy linked to a Parliamentary Library paper Countries trading greenhouse gas emissions.

Over the last three years, the global carbon market has more than doubled in volume but almost halved in value. In that time a further eight countries, states or cities have adopted a carbon market as their primary means for reducing greenhouse gas emissions. Yet the price for one tonne of carbon dioxide equivalent has dropped by as much as 100 per cent in some markets.

That last sentence looks like an oops! A 100% drop gives you nothing!

The paper is the most recent of 25 on climate change in the past few years. In fact their blog Flagpost looks a valuable resource.

6. Floods in Central Europe

Dramatic floods have spread over central Europe.

The New Scientist reports caution about a link with climate change:

While it is premature to pin the heavy rainfall on climate change, it could be partly to blame, says Stéphane Isoard of the European Environment Agency in Copenhagen, Denmark. But he says bad land management is just as important.

Nevertheless wetter weather is predicted by climate change, making more floods inevitable.

Deutsche Welle goes into more detail, saying that while individual events can’t necessarily be linked to climate change, they’ve had once in a century floods now in the 1990s, in 2002 and now in 2013. We’ll have to expect more and prepare accordingly.

They make reference to Stefan Rahmstorf’s blog (which is auf Deutsch), but this paper is in English. On a quick look I think he’s saying they have found a mechanism linking floods, droughts and heat waves to climate change and if they are right expect more. And, yes they need money for research of the kind expended on the Higgs boson.

7. Interest grows in the Arctic

Now that the Arctic is increasingly becoming trafficable during the summer many countries are becoming interested. The politics of who sits where at the Arctic Council is complex, but China, Japan, South Korea, Singapore, India and Italy have now been admitted as permanent observers.

According to the New Scientist China is the one to watch. They’re interested in the Arctic as a shipping route, but also in fish and oil.

“It’s fair to say China will drive development of Arctic resources,” says Malte Humpert of the Arctic Institute in Washington DC.

The Arctic is fragile so we hope they take care.

8. US and China agree to cooperate on phasing out HFCs

From the White House brief:

For the first time, the United States and China will work together and with other countries to use the expertise and institutions of the Montreal Protocol to phase down the consumption and production of hydrofluorocarbons (HFCs), among other forms of multilateral cooperation. A global phase down of HFCs could potentially reduce some 90 gigatons of CO2 equivalent by 2050, equal to roughly two years worth of current global greenhouse gas emissions.

William S. Becker explains that China had always wanted to consider the issue in the context of the current round of climate talks, which would delay action, whereas the Montreal Protocol already exists. HFCs were introduced as an alternative to chlorofluorocarbons (CFCs) which were destroying the ozone layer. Unfortunately HFCs have a greenhouse effect like CO2.

Climate Progress has more detail and the AFP places this topic in context of the whole meeting agenda.

To provide further context HFCs amount to about 2% of GHG emissions, as shown on this wondrous flowchart.

Climate clippings 73

In this edition I’ve stuck to scientific articles, and, incidentally have used a couple (items 3 and 4) from stuff I gathered around this time last year when I thought I might be launching a new blog. For reasons we won’t go into it didn’t happen at that time.

1. Arctic ice watch

While we were on sabbatical last year the northern cryosphere had an exciting time. There was a giant storm in the Arctic ocean, Greenland surface melt covered virtually the whole ice sheet and all sorts of records were broken in the Arctic summer sea ice melt. I’m hoping to do an update to catch us up, but follow this link to see a dramatic animation of Arctic sea ice volume loss since 1979. I’ve posted this image to show how far we’ve come:

volume-comparison-1979-2012-v4

You can monitor Arctic sea ice extent on the NSIDC site. This image is a screenshot from the interactive graph on that page showing the way summer sea ice is sagging:

Sea ice extent_cropped_580 Continue reading Climate clippings 73

Climate clippings 71b

This post was written in October 2012 trialling the site. I’ve decided to leave it in time sequence and fiddle the numbering.

1. Did climate change shape human evolution?

There’s no evidence yet that it did according to Richard Leakey.

I’m not sure about his four key questions, though. Yes, bipedalism seems to be important as does using tools to make tools. But I can’t see the importance of migration out of Africa as important to our evolution. Apart from picking up some Neanderthal genes presumably in a palm grove somewhere in the Middle East, which did boost our immune system, those of us who left Africa are much the same genetically as those who stayed behind.

I’d say the development of language was important. If you want a fourth I’d suggest our patterns of social organisation – how we interact and how we co-operate within groups. But I don’t know how much of that is in our genes.

2. Aid for climate refugees

Speaking of climate and migration, displacement by extreme weather events does not qualify you as a refugee under present UN arrangements. The International Organisation of Migration (IOM) hopes this will change at the annual United Nations climate change summit to be held in Qatar later this year, gaining access to the Green Climate Fund (GCF) and other sources. It seems that 42 million people were displaced by storms, floods and droughts in Asia and the Pacific during 2010 and 2011.

3. Ocean heat content update

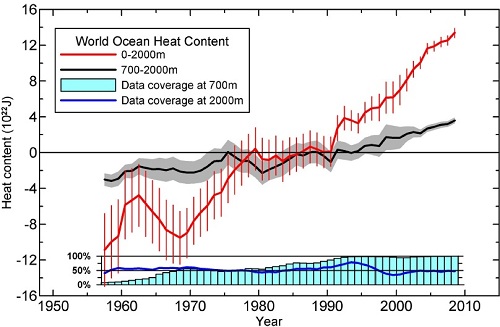
Skeptical Science recently posted on an update by Levitus et al on ocean heat content, which increases apace. Around 93% of additional warming goes into the ocean which is truly vast with, for example, an average depth of around 3,790 metres. This graph indicates the changing heat content within bands of the upper 2000m:

4. Southern Ocean research shows decrease in dense Antarctic bottom water

Antarctic Bottom Water is a massive current of super dense salty water which used to be which used to occupy the bottom mile of the Great Southern Ocean. Used to. Researchers are now able to report that the current is diminished by 60% compared to what it was in 1970.

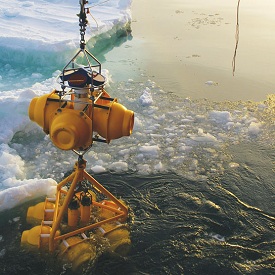
Antarctic Bottom Water is colder than the normal freezing point and is a vast store of CO2. Understanding changes in this deep ocean current are crucial to understanding the likely future of global climate patterns as the planet warms. The researchers have not only been able to make direct observations, they have distributed buoys which should be able to provide data at times of the year when field work is impossible.

5. Plants flower faster than climate change models predict

For years scientists have been doing experiments to find out how much earlier plants will flower and leaf with global warming. A new study using field observations has found that plants are responding much faster than they had thought. Their research suggests that that spring flowering and leafing will continue to advance at the rate of 5 to 6 days per year for every degree celsius of warming.

What surprises me is that they thought they could model natural conditions in the lab.

It seems they will have to rethink the impacts of global warming on ecosystems and food production.

See also Science Daily.

6. Climate change experimentation goes bush

Another approach is to manipulate the environment on a large scale and monitor what happens. Researchers are using to control the amount of CO2 available to plants.

The idea is explore the role of “Australia’s large tracts of undeveloped land, known as bush” in storing carbon. They will be able to add carbon or take it away.

I’m not sure it doesn’t suffer from the same problems as experiments with plants, where only one variable was controlled, neglecting changes in precipitation patterns and cloudiness, for example.

7. Wind farms do not cause global warming

There has been a raft of articles in the MSM suggesting that wind farms cause global warming, mainly in the headlines, it seems.

In fact a study of some large wind farms in remote areas of Texas found local warming. The authors don’t know what’s going on but the suggestion is that thermal energy is being redistributed, perhaps by pulling down warmer air from higher altitudes during the nights.

For the spinning blades of wind turbines to increase the overall temperature of the planet some basic laws of physics would need to be rewritten.

Climate clippings 61

David Archer on methane

Arctic methane plumes

Climate clippings 58 led with an item on Methane worries. @ 18 I identified David Archer as one who is “very knowledgeable on the matter [and] thinks the process will be chronic rather than catastrophic.” Continue reading Climate clippings 61

Climate clippings 53

GLOBAL warming is unusual

A common response to AGW warmists is that climate has always changed and always will. It’s natural and humans have nothing to do with it. Now via Climate Progress we learn from a study by Svante Björck of Lund University that apart from general moves into and out of ice ages the hemispheres do not warm or cool in sync. When one hemisphere changes the other stays the same or moves in the opposite direction. For example he found that during the Little Ice Age in Europe there were no corresponding changes in the southern hemisphere.

Last week I posted this graph to show that we are giving the system a helluva jerk. In fact we need to go back 15 million years to find CO2 levels as high as today. (if you are concerned about Antarctic thawing be very afraid.)

However, the following graph shows that the hemispheres are not perfectly in sync now:

Hemispheric land-ocean temperatures

The northern hemisphere is pulling away. The reason, presumably, it has more land, and at higher latitudes. Continue reading Climate clippings 53

Climate clippings 51

Environmental change and migration

The British Government Office for Science has published a report Foresight: Migration and Global Environmental Change (Financial Times article here) looking at displacement and migration, both internal and transnational, due to environmental factors up to 2050.

Moving can be to a place of greater vulnerability, as from drought devastated area to a flood plain, or it can be part of the solution. There is concern over vulnerable populations that can’t move. Effectively they are “trapped”.

17 million people were displaced by natural hazards in 2009 and 42 million in 2010 (this number also includes those displaced by geophysical events).

Future numbers are impossible to estimate.

For the report itself, download from here or go directly to the Executive summary.

There more at Climate Spectator. Continue reading Climate clippings 51