Category Archives: Climate Science

CO2 hits 400 ppm

On May 9 CO2 reached 400 ppm at the National Oceanic and Atmospheric Administration’s (NOAA) monitoring centre at Muana Loa and at at the Scripps Institution of Oceanography in San Diego, California. This is what’s been happening over the last 130 years in broad terms:

co2-temp_570

It seems many news organisations, for example the BBC, and some scientists are stressing that the last time concentrations were so high was 3 to 5 million years ago. In the linked article Michael Mann, director of the Earth System Science Center at Penn State gives a different view:

Mann said the last time scientists are confident that CO2 was sustained at the current levels was more than 10 million years ago, during the middle of the Miocene Period. Continue reading CO2 hits 400 ppm

Climate clippings 73

In this edition I’ve stuck to scientific articles, and, incidentally have used a couple (items 3 and 4) from stuff I gathered around this time last year when I thought I might be launching a new blog. For reasons we won’t go into it didn’t happen at that time.

1. Arctic ice watch

While we were on sabbatical last year the northern cryosphere had an exciting time. There was a giant storm in the Arctic ocean, Greenland surface melt covered virtually the whole ice sheet and all sorts of records were broken in the Arctic summer sea ice melt. I’m hoping to do an update to catch us up, but follow this link to see a dramatic animation of Arctic sea ice volume loss since 1979. I’ve posted this image to show how far we’ve come:

volume-comparison-1979-2012-v4

You can monitor Arctic sea ice extent on the NSIDC site. This image is a screenshot from the interactive graph on that page showing the way summer sea ice is sagging:

Sea ice extent_cropped_580 Continue reading Climate clippings 73

Global heating update

Little ice age_130421152401-270

Last month we had a look at the Bigger, better, new hockey stick from a study by Marcott et al. Since then Skeptical Science has a post on the phoney skeptical/denialist critique of the study. We now have a new study, Continental-scale temperature variability during the past two millennia, by 78 scientists from 24 nations analyzing climate data from tree rings, pollen, cave formations, ice cores, lake and ocean sediments, and historical records from around the world published in the journal Nature Geoscience. The study found:

There were no globally synchronous multi-decadal warm or cold intervals that define a worldwide Medieval Warm Period or Little Ice Age, but all reconstructions show generally cold conditions between ad 1580 and 1880, punctuated in some regions by warm decades during the eighteenth century.

The real interest was in the regional variations on a continental scale. Temperatures were identified for the Arctic, North America, South America, Europe, Asia, Australasia and the Antarctic. There was insufficient data for Africa. Continue reading Global heating update

Tipping point for climate action?

Recently the Climate Commission issued a report in its The Critical Decade series on Extreme Weather looking at the issues of

  • Heat
  • Bushfires
  • Rainfall
  • Drought, and
  • Sea level rise.

At Radio National’s The World Today Professor Lesley Hughes, a Macquarie University ecologist, talked to Eleanor Hall.

The report looks at extreme weather experience in recent times, such as that documented in the Commission’s report The Angry Summer, puts it in a broader context using the latest science and then uses that as a window to project into the future. The message is plain. The climate has shifted, expect more and more extreme weather and we need to act now.

we really need to view all these events not in isolation but as part of a trend for the future. We need to prepare for them and we need to do our absolute best to cut greenhouse gases to stabilise the climate to prevent them getting to the point at which we cannot adapt.(Emphasis added)

Continue reading Tipping point for climate action?

Hansen retires to embrace activism

Activist_cropped

We are going to see more images like the one on the left, it seems. I picked up the news from a Google feed to this article at mother nature network. Climate scientist James Hansen has retired at the age of 72 from NASA GISS in order to concentrate on activism. The scoop was claimed by the New York Times. Climate Progress quickly picked up on the story.

Hansen first made a splash with an article with six other scientists in 1981. After his testimony to Congress in 1988 he retired from public advocacy and communication for about 15 years, concentrating on the science and his administrative role at NASA GISS, to become publicly active again from about 2003.

NASA’s press release on his retirement emphasises that his research was closely aligned with:

the development of increasingly sophisticated satellite platform measurements, such as the terrestrial radiation budget, ozone and weather-related data, and the need for increasingly sophisticated atmospheric models to assess and evaluate the information content and utility of these measurements.

Also the use of models to make climate change predictions for the future. Continue reading Hansen retires to embrace activism

New bigger, better hockey stick

Holocene_Temperature_Variations_Rev_300 One of the most contested graphs in climate science has been the hockey stick. Inconveniently for gain-sayers later science has confirmed the shape of the thing as sites such as Skeptical Science and New Scientist confirm.

The hockey stick was confined to temperatures for the last 1000 years. Graphs of the whole Holocene era were rare, although they did exist, as the featured image above. Now a study by Marcott et al has used 73 proxies to study average global temperature for the whole Holocene period of the last 11,300 years. You can read about it at New Scientist, Mother Jones, Climate Progress here and here. Continue reading New bigger, better hockey stick

National greenhouse emissions accounts

Tristan Edis at Climate Spectator makes a valid point that insufficient attention has been given to the increase in mining emissions in our national inventory.

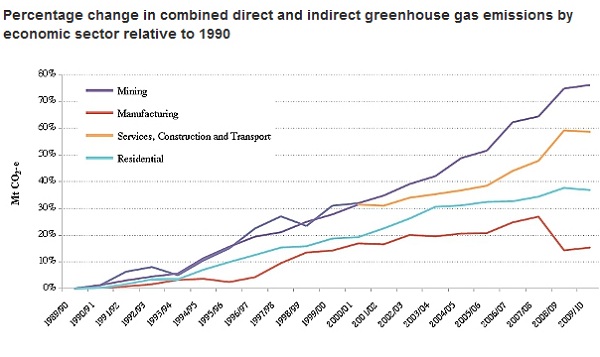
The two graphs displayed represent change in emissions. To provide context we really need to know the total quantum of emissions for each category. So I looked for the source of his graphs.

Turns out there is no one source. You have to go to this page. There is also a search facility here.

Edis has chosen his graphs well to make the points he makes, but some of the impressions may be misleading. Mining is the fastest growing sector but agriculture, residential and manufacturing are all still larger sectors. And residential in his graphs is only about half electricity consumption. The other half is mostly transport, but also includes emissions generated at residences, presumably mainly from gas. There are many messages you can dig out of the mine of information provided online. I’ll try to give a brief overview here.

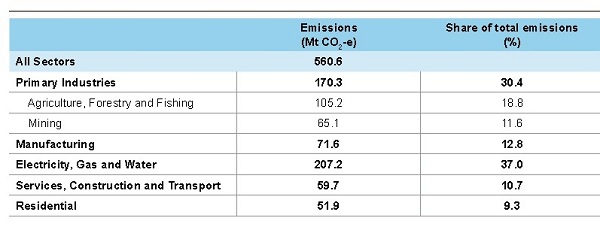
This table, from the National Inventory by Economic Sector 2009/10 gives a snapshot of Australia’s direct emissions, that is from the point they are generated:

Direct emissions

Land use, land use change and forestry (LULUCF) activities are included.

The figure for electricity needs to be largely distributed across the other sectors. For example, the residential figure cited here would comprise only transport plus other emissions generated at homes.

Edis’s first graph is Figure 6 in the Quarterly Update of Australia’s National Greenhouse Gas Inventory: December 2011. I’ll skip it and go to his second graph, which is Figure 7 of National Inventory by Economic Sector 2009/10:

Percentage change in direct and indirect emissions

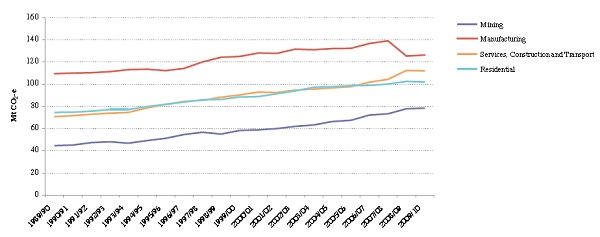
The MtCO2e on the y-axis should have been omitted. Use of grid electricity is included in each sector. Agriculture is left out. It really should have been accompanied by Figure 6:

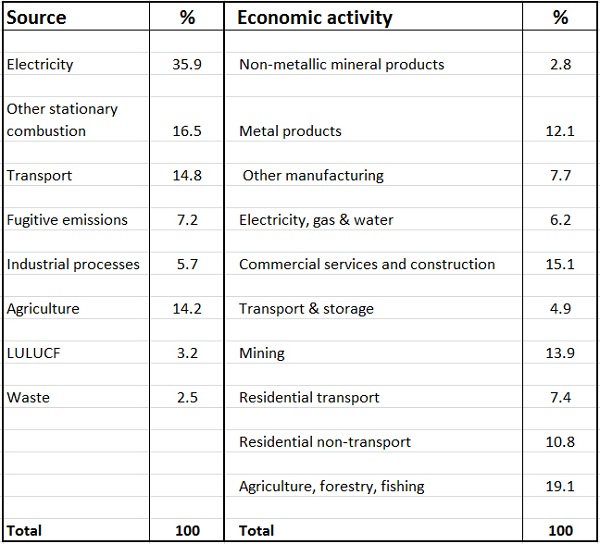
The graph that best captures everything happening now (at least in 2002-2010) is Figure 8 from the same document (p20). The graph is too big to reproduce here, so I’ve made this table:

Some thoughts.

Given the size of the electricity sector as a source and its potential in reducing emissions in the transport sector, clearly decarbonising electricity generation would go almost half way towards achieving zero emissions. Tackling electricity generation and transport represent the low-hanging fruit.

We have to ask whether an emissions trading system (ETS) by itself will achieve this in a time frame compatible with avoiding dangerous climate change. Recently I heard on Radio National that the fall in the demand for electricity is effectively locking in coal as a source of baseload power. If this article is correct we are spending $100 billion on a grid which will not be capable of handling diversified power generation.

This article is one of many detailing the falling electricity demand and some of the implications.

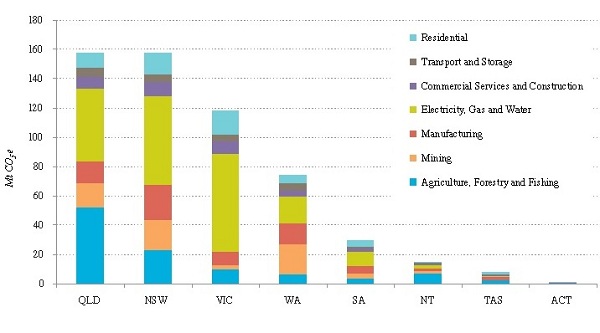
From the National Inventory by Economic Sector document, Figure 3 gives the direct emissions for each state:

Queensland would be the champion in per capita terms.

The Queensland LNP Government has decided to axe the policy and programs section of the Office of Climate Change. ‘Can-do’ can do whatever he wants!

Climate clippings 71b

This post was written in October 2012 trialling the site. I’ve decided to leave it in time sequence and fiddle the numbering.

1. Did climate change shape human evolution?

There’s no evidence yet that it did according to Richard Leakey.

I’m not sure about his four key questions, though. Yes, bipedalism seems to be important as does using tools to make tools. But I can’t see the importance of migration out of Africa as important to our evolution. Apart from picking up some Neanderthal genes presumably in a palm grove somewhere in the Middle East, which did boost our immune system, those of us who left Africa are much the same genetically as those who stayed behind.

I’d say the development of language was important. If you want a fourth I’d suggest our patterns of social organisation – how we interact and how we co-operate within groups. But I don’t know how much of that is in our genes.

2. Aid for climate refugees

Speaking of climate and migration, displacement by extreme weather events does not qualify you as a refugee under present UN arrangements. The International Organisation of Migration (IOM) hopes this will change at the annual United Nations climate change summit to be held in Qatar later this year, gaining access to the Green Climate Fund (GCF) and other sources. It seems that 42 million people were displaced by storms, floods and droughts in Asia and the Pacific during 2010 and 2011.

3. Ocean heat content update

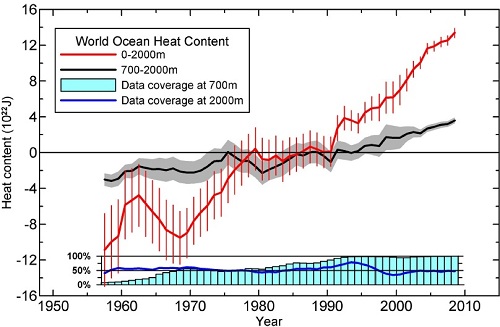
Skeptical Science recently posted on an update by Levitus et al on ocean heat content, which increases apace. Around 93% of additional warming goes into the ocean which is truly vast with, for example, an average depth of around 3,790 metres. This graph indicates the changing heat content within bands of the upper 2000m:
4. Southern Ocean research shows decrease in dense Antarctic bottom water
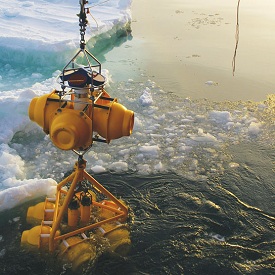
Antarctic Bottom Water is a massive current of super dense salty water which used to be which used to occupy the bottom mile of the Great Southern Ocean. Used to. Researchers are now able to report that the current is diminished by 60% compared to what it was in 1970.

Antarctic Bottom Water is colder than the normal freezing point and is a vast store of CO2. Understanding changes in this deep ocean current are crucial to understanding the likely future of global climate patterns as the planet warms. The researchers have not only been able to make direct observations, they have distributed buoys which should be able to provide data at times of the year when field work is impossible.

5. Plants flower faster than climate change models predict

For years scientists have been doing experiments to find out how much earlier plants will flower and leaf with global warming. A new study using field observations has found that plants are responding much faster than they had thought. Their research suggests that that spring flowering and leafing will continue to advance at the rate of 5 to 6 days per year for every degree celsius of warming.

What surprises me is that they thought they could model natural conditions in the lab.

It seems they will have to rethink the impacts of global warming on ecosystems and food production.

See also Science Daily.

6. Climate change experimentation goes bush

Another approach is to manipulate the environment on a large scale and monitor what happens. Researchers are using to control the amount of CO2 available to plants.

The idea is explore the role of “Australia’s large tracts of undeveloped land, known as bush” in storing carbon. They will be able to add carbon or take it away.

I’m not sure it doesn’t suffer from the same problems as experiments with plants, where only one variable was controlled, neglecting changes in precipitation patterns and cloudiness, for example.

7. Wind farms do not cause global warming

There has been a raft of articles in the MSM suggesting that wind farms cause global warming, mainly in the headlines, it seems.

In fact a study of some large wind farms in remote areas of Texas found local warming. The authors don’t know what’s going on but the suggestion is that thermal energy is being redistributed, perhaps by pulling down warmer air from higher altitudes during the nights.

For the spinning blades of wind turbines to increase the overall temperature of the planet some basic laws of physics would need to be rewritten.

Climate clippings 71

1. State of the climate 2012

BOM amd the CSIRO have produced the State of the Climate – 2012 report. BOM has a handy summary summary and link to the brochure. The CSIRO site has some added interviews. I’ve extracted two images. First is the relentless increase in ocean heat content:

Ocean heat content

Second is the rainfall pattern for April to September from 1997 to 2011:

Rainfall April to September, 1997-2011

According to the report we can expect the same only more so in the future.

See also The Conversation. Continue reading Climate clippings 71

Climate clippings 70

Stuff happens. We have a household of three with separate access to our online service and last week the youngest member blew our monthly usage budget downloading games, 11 days out from when it renews automatically on 17 March. So the speed became truly painful. Bigpond have given us a once only ‘goodwill’ 2 gigs to go on with. Trouble is, by he time I found out what was going on we’d already used a third of it.

Trouble also is that when the speed slows my email connection just doesn’t happen.

Anyway I’ve prepared a CC for this week from material to hand, then I’m going to disappear to preserve my email.

1. You’ve been told

When a link came through on a feed about a conference on what the planet would be like with 4C warming it looked a bit familiar. Then I noticed the date – October 2009. The link is now broken, but the conference is here. There’s a lot of good material in the presentation downloads, mostly depressing, some of which I looked at before things gummed up.

In the article it said that Hans Joachim Schellnhuber, who advises Angela Merkel on climate change, had dropped in on President Obama’s top people, who told him that the political system couldn’t cope with what he was saying about the science. Prof Scellnhuber was not impressed. Continue reading Climate clippings 70

Climate clippings 69

1. Electric cars

you have about 750 million cars in the world today; you’re going to have about 1.3 billion cars in about 25, 30 years; and you can’t expect them all to be running on gasoline. There isn’t that much gasoline around.

Stan Correy has a look at the future of the car industry and our potential place in it on ABC RN’s Background Briefing.

Evan Thornley, who is behind Better Place, thinks our niche in the electric car future is in the larger powerful muscle car, where we have always been. Continue reading Climate clippings 69