Category Archives: Climate Science

A choice of catastrophes: the IPCC budget approach

wg1cover_175Below I’ve set set out some of the main findings in the Summary for Policymakers (downloadable from here) from the IPCC’s Climate Change 2013: The Physical Science Basis before looking at what they say about the wriggle room remaining to us (ie. the ‘climate budget approach’) if we want to avoid dangerous climate change.

This post follows the introductory post Crisis or catastrophe? What will the IPCC say?

In this report they’ve set up a reference pattern which will be followed unless otherwise specified in the remaining volumes, so we’d better wrap our minds around it.

The basic concept is that of Representative Concentration Pathways (RCPs) which are expressed in terms of watts per square metre of radiative forcing (W m-2). So when looking at phenomena such as future temperature change or sea level rise there is no ‘business as usual’ (BAU) scenario. Four scenarios have been chosen – RCP2.6, RCP4.5, RCP6.0 and RCP8.5. These are described as, respectively, a mitigation scenario leading to a very low forcing level, two stabilisation scenarios and one scenario with very high greenhouse gas emissions. The last (RCP8.5) is perhaps the equivalent of BAU or a ‘no climate change policy’ scenario.

AR5 uses four time reference points, two past and two future – 1850-1900, 1986-2006, 2046-2065 and 2081-2100.

I have called 1850-1900 ‘pre-industrial’, while 1986-2005 is roughly ‘now’. It needs to be borne in mind that the 0.61C warming had already taken place from pre industrial times to 1986-2005. Looking forward 2046-2065 is ‘mid-century’ while 2080-2100 is roughly the end of the 21st century.

I’ve prepared a spreadsheet showing in the first column the prospective temperature rise from ‘now’ to the end of the 21st century. The second column adds in the warming from pre-industrial until ‘now’. Finally I’ve tabulated the increase from pre-industrial to mid-century. I’ve only quoted the mean values so that the signal doesn’t get lost in the noise.

Figure 1: RCP temperature scenarios

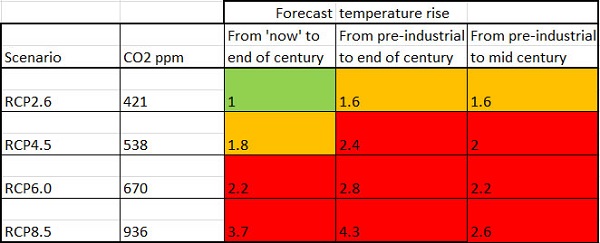
I’ve used green to indicate a comparatively ‘safe’ climate, orange to indicate the increasingly contested zone which clearly carries some danger, and red to indicate breaching the 2C guardrail which everyone with half a brain accepts as dangerous.

What needs to be emphasised here is the non-linearity of climate vulnerability and risk. As temperatures increase the potential for nasty surprises or ‘tipping points’ increases, but frankly we are already entering that zone.

Some points to note here. Firstly, the change from 1880 to 2012 (the real ‘now’) is given as 0.85C (0.65 to 1.06 with 90% certainty).

Secondly, while the CO2 levels are linked to certain watts per square metre in the RCPs the CO2 levels stand as a marker for all greenhouse gases. The RCPs don’t change if you additionally identify the MH4 and NO levels, as they are already included in the calculations.

This table from the report shows the forecast temperatures, plus sea level rise, with uncertainty ranges.

Table 2: RCP scenarios for temperature and sea level rise
Table 2: RCP scenarios for temperature and sea level rise___

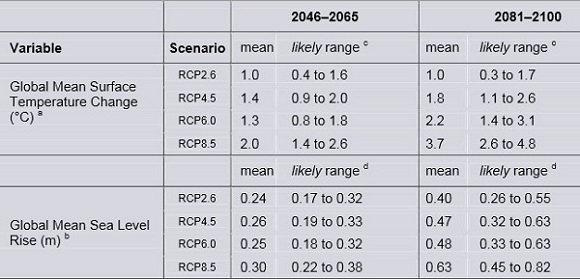
The uncertainty range is a bit narrower than it was in AR4 in 2007. Please note, the text actually gives the range for RCP8.5 as 0.52 to 0.98m.

If we discard RCP2.6 because it won’t happen the total range of prospective sea level rise is 32cm to 82cm, with medium confidence. A linear extrapolation of the current rate of 3.2mm pa will yield the lower bound of that range. Also we are told:

Confidence in projections of global mean sea level rise has increased since the AR4 because of the improved physical understanding of the components of sea level, the improved agreement of process-based models with observations, and the inclusion of ice-sheet dynamical changes.

Furthermore:

Based on current understanding, only the collapse of marine-based sectors of the Antarctic ice sheet, if initiated, could cause global mean sea level to rise substantially above the likely range during the 21st century. However, there is medium confidence that this additional contribution would not exceed several tenths of a meter of sea level rise during the 21st century.

Under RCP8.5, however, the annual rate of change by 2100 will be from 8mm to 16mm, with a mean nearly four times the current rate. Apart from RCP2.6 sea level rise will continue in subsequent centuries.

RenewEconomy has a simple summary of the report, which includes this on precipitation:

Changes in the global water cycle in response to the warming over the 21st century will not be uniform. The contrast in precipitation between wet and dry regions and between wet and dry seasons will increase, although there may be regional exceptions.

Evidence for human influence has strengthened since AR4. It is now considered extremely likely (formerly very likely) that human influence has been the dominant cause of the observed warming since the mid-20th century. Moreover,

There is high confidence that changes in total solar irradiance have not contributed to the increase in global mean surface temperature over the period 1986 to 2008, based on direct satellite measurements of total solar irradiance.

Here’s the graph of radiative forcing:

Figure 1: Radiative forcing drivers
Figure 1: Radiative forcing drivers___

Here’s the historic graph for temperature rise, showing clearly that warming is still occurring:

Figure 1: Land and ocean surface temperature anomaly 1850-2012
Figure 2: Land and ocean surface temperature anomaly 1850-2012

Crisis or catastrophe – the climate budget crunch

Generally speaking, the 4C limit is said to be the point at which civilisation as we know it is threatened. Of relevance here, the AR5 document tells us that the near-complete melting of the Greenland ice sheet will occur, over a millennium or more, with a temperature rise of somewhere between 1C and 4C relative to pre-industrial.

The report still uses the guardrail of 2C temperature rise relative to 1861-1880 (Figure 2 shows that this would be similar to 1850-1900) in order to mark dangerous climate change. You’ll get plenty arguments about that. Bolivia, for example, wants to use 1C as the limit for a safe climate. In this post I noted that some developing countries sought a lower guardrail of 1.5C rather than 2C while the African civil society group Pan African Climate Justice Alliance (PACJA) wanted 1 to 1.5C.

David Spratt asks the question as to whether current levels of CO2 are already dangerous. His answer is unsettling, to say the least. What do our politicians think of the notion that we need to keep the temperature rise to less than 1.5C if we want to preserve more than 10% of corals worldwide?

He also found that during the Eemian 120,000 years ago we had three metres of sea level rise within 50 years with much gentler forcing than we have now, in probably the best analogue of what lies before us.

In a warming world what matters is the total quantum of CO2 in the atmosphere. The ‘climate budget approach’ identifies the total anthropogenic CO2 emitted to cause warming of 2C. For a 66% chance of staying under 2C the total CO2 emitted must not exceed 1000Gt, according to calculations done by Malte Meinshausen and others back in 2009. The later we leave cutting the harder we have to cut. Meinshausen’s article in Nature is paywalled, but this graph in an article by Stefan Rahmstorf (in German) gives the idea:

Figure 3: Meinshausen's emissions reduction options
Figure 3: Meinshausen’s emissions reduction options

Rahmstorf’s text talks about 1000Gt of CO2 or about 1500GT of CO2 equivalent with other greenhouse gases for a 25% chance of staying within 2C. Forget the precise figures, it’s the pattern of peaking and subsequent reductions that matter.

Now, as Giles Parkinson reports, the carbon budget figures have taken a haircut to become 800Gt for a 66% chance of 2C when “accounting for non-CO2 forcings”. Problem is we’d already used up 543Gt of the budget by 2011.

Fiona Harvey at The Guardian tells us that the decision to put the numbers in the report was hard-won. There was concern they “would have political repercussions”. I think that was the intention!

Oliver Milman also at The Guardian, tells us that cuts of 10% per annum will now be necessary, though I can’t find that in the report. He doesn’t say from when. This graph, from the Climate Commission’s 2011 The Critical Decade report (the site is now down the crapper – my summary is here), shows 9% pa from 2020 for a 66% chance.

Figure 4: Emissions reduction options

I suspect the new 10% is from 2015 or 2017.

The above graph is sourced from a substantial 2009 document (in German) produced by WBGU (The German Advisory Council on Global Change) making the case for a carbon budget approach. Of more use to us is their English summary which on page 5 outlines the steps to be taken to provide an equitable way forward. The high polluting countries should take urgent steps to reduce emissions. Developing countries are then given space to increase emissions before reducing. The strategy is captured in this graph:

Figure 5: The climate budget approach

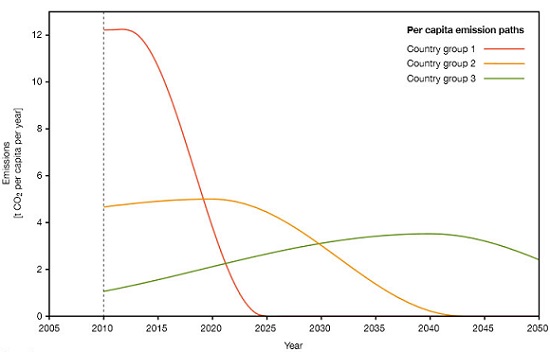
The red line represents the industrialised countries, green the developing countries. Newly industrialising countries such as China, Thailand and Mexico are represented by orange. With world-wide carbon trading (a world climate bank is proposed) the pattern would be varied along these lines:

Figure 6: The carbon budget approach with carbon trading

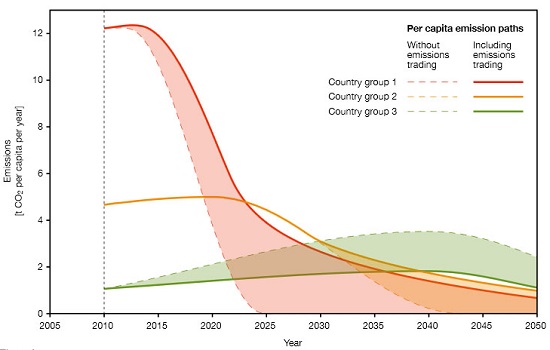
By 2100 all countries are allowed the same per capita emissions.

There is no doubt at all that the Germans and possibly the Europeans hoped for a deal along these lines from the UNFCCC meeting in Copenhagen in 2009. In the end a weak ‘contribute what suits you’ deal was cooked up in a small unofficial meeting that took place when President Obama went looking for his Chinese counterpart and found him ensconced with the leaders of India, Brazil, South Africa and others. The Europeans were not in the room. To say they were pissed off is an understatement. Nor was our man Rudd in the room, one of three leaders appointed to assist the Danish chair.

Now we have a deal to conclude a deal by 2015 within the UNFCCC framework, to be implemented from 2020. We’ve lost five years and the task is immensely harder.

Parkinson notes that our skinny remaining carbon budget means we can only afford to use about 10% of the world’s known fossil fuel reserves. But there is $4 trillion of shareholder value tied up in 200 listed companies in the industry carrying $1.5 trillion in loans. Writing down the value of that lot could break a few banks deemed too big to fail.

We’ve got a crisis for sure and a choice between two catastrophes.

It will be interesting to see what the mitigation working group comes up with. For my money, whatever they propose the Americans and the Chinese will not be pinned down to anything binding. In both cases their internal politics will not allow it.

The full WG1 report is now available. It’s 2126 pages long and they ask you not to quote it yet.

I outlined the budget approach in a post in January 2011:
Climate crunch: the fierce urgency of now.

This was a repost and update of one I did in May 2009, Climate crunch which linked to a special edition of Nature where I think an early version of the Potsdam climate budget approach was outlined.

The post Suffer the little children told the story of what happened in Copenhagen and beyond.

Crisis or catastrophe? What will the IPCC say?

In sum, the dynamics of the global coupled human-environmental system within the dominant culture precludes management for stable, sustainable pathways and promotes instability.

In other words, we’re f*cked!

That quote was from here, linked from Christopher Wright.

The quote was actually from the abstract of a sober, technical paper by geophysicist Brad Werner. The IPCC Fifth Assessment Report will also be sober and technical, based on peer reviewed literature, at least accepted for publication two to three months before the draft of each section is finalised, plus ‘grey’ material, which I take it means reliable sources such as government reports and reports prepared by or for organisations such as the International Energy Association, the World bank and our erstwhile Climate Commission.

There will be three working group reports, each with a summary for policymakers, plus a synthesis report. The working groups are:

    WG1: The Physical Science Basis
    WG2: Impacts, Adaptation and Vulnerability
    WG3: Mitigation of Climate Change

It remains to be seen how urgent and dramatic the summaries for policymakers will be. The full import won’t be on view until the publication of WG3 in April next year, but the first should give us an idea of the seriousness of the situation.

Here’s the timetable for releasing the reports:

WG1_cropped_c

Here’s the site for WG1. Here’s where the Summary for Policymakers should appear on 27 September. Here are the chapter headings of the report, due on Monday: Continue reading Crisis or catastrophe? What will the IPCC say?

Arctic sea ice extent minimum for 2013

The summer melt of the Arctic appears to have reached it’s limit with the sea ice extent at 5.1 million km2 (cf. the 3.41 million km2 record in 2012) as shown on this graph from the NSIDC’s Arctic Sea Ice News and Analysis site:

2013_cropped_580

The black line is the 1981-2010 average, plus and minus two standard deviations. The blue is 2007 and the dotted line represents the 2012 record. This year is the sixth lowest on record as this graph from Skeptical Science shows: Continue reading Arctic sea ice extent minimum for 2013

Climate clippings 83

Climate clippings_175These posts are intended to share information and ideas about climate change and hence act as an open thread. Again I do not want to spend time in comments rehashing whether human activity causes climate change.

This edition contains items, exclusively, I think, in climate science and impacts. The thread is meant to function also as a roundtable to share information and ideas.

1. Climate change picked the crops we eat today

The New Scientist carries a story about how some cereals we know today were changed by the climate as we came out of the last ice age. Researchers at the University of Sheffield, UK took seeds of precursors of modern wheat and barley found with human remains in a 23,000-year-old archaeological site in Israel. They grew these together with four wild grass species that aren’t eaten today, but were also known to grow in the region at that time, and grew them under conditions replicating levels of CO2 then and also the higher levels when farming first arose 10,000 years ago.

All the plants grew larger under the higher levels of CO2, but the relatives of wheat and barley grew twice as large and produced double the seeds. This suggests the species are especially sensitive to high levels of CO2, making them the best choice for cultivation after the last ice age.

The team plan to look at whether other food staples around the world are similarly affected by elevated CO2 levels, for example millet grown in Asia and maize in North America. They also plan to compare the effects of CO2 on legumes such as peas. Continue reading Climate clippings 83

Climate clippings 82

I’m not planning to do posts on the upcoming election apart from link posts if I see anything interesting and/or important. The post on the Murdoch’s intervention started out as a link post, but then I warmed to the task. While this space is open I’d like to explore a theme that came from a comment in reaction to the LNP ‘solution’ to the asylum seeker ‘problem’. I can’t find it now, but someone asked, “What have we become?”

Moreover, what will we become? We have a choice, and in our response to the stranger in need who has chosen us, we either grow or diminish ourselves.

The task is ambitious and I’m not academically equipped for it. I’m not speaking as a philosopher or a sociologist, just “someone who is trying to sort out his ideas”, so the results may be modest. Some of the posts may not appear to be directly on the topic, but I hope all will fit together in the long run.

Climate clippings_175Meanwhile I’ll try to keep some information flowing on climate change. Both these projects may be of more use than any contribution I can make to an election here in Oz. This time CC will be free flow rather than numbered items, to save time. I’ll use bold to identify the topics.

Arctic ice is losing its reflective sheen. We all know that ice reflects more incoming radiation from the sun than does open water. Now by analysing 30 years of satellite data scientists have found that albedo of the ice itself at the end of the summer is about 15% weaker today than it was 30 years ago.

The cause of the darkening is

partly due to thinning ice and the formation of open water fissures, and partly because in the warmer air, ponds of liquid water form on the surface of the ice. The shallow ponds on the ice can dramatically reduce reflectivity and increase the amount of solar radiation that the ice absorbs.

Continue reading Climate clippings 82

Pine Island Glacier spawns a giant iceberg

As David Spratt posted at Climate Code Red a giant crack has opened across the full width of the Pine Island Glacier (PIG) ice shelf, spawning a new iceberg about 720 square kilometres in area, roughly eight times the size of Manhattan Island in New York. This is about the best photo I can find:

Pine Island Glacier_dn23847-1_450

We’ll get some orientation first and then look at the implications. This image locates the PIG on the continent of Antarctica:

AntarcMapPelto-300x255

This image from the LiveScience photo gallery outlines the PIG basin:

Pine Island Gl;acier_pi-3-PIG_map_Bodentopograpfie_beschriftet_w

This basin together with the Thwaites Basin just to the south drains 40% of West Antarctica. These two glaciers alone could lead to sea level rise of half a metre by 2100 according to material cited by Spratt. Continue reading Pine Island Glacier spawns a giant iceberg

Climate clippings 80

Climate clippings_175In these posts the aim is to include eight segments averaging 125 words long with sufficient detail so that casual readers can get the sense of the featured article without following the links, which are there for those interested in more detail. Lately I have been alternating week by week collections of science/observations/predictions and practical matters associated with adaptation and mitigation.

During the last week of political distractions I have had about half my usual time at the computer. Moreover some segments just won’t fit within the 125 word constraint. Next cab off the rank, I hope, will be President Obama’s climate initiative, which demands extended treatment.

So for the next little while I’ll attempt to post whatever I have to hand every Tuesday until things settle down a bit.

As usual these posts are intended to share information and ideas about climate change and hence act as an open thread. And again I do not want to spend time in comments rehashing whether human activity causes climate change.

1. Climate change measuring instruments are on life support

That’s the story from John Abraham at Climate Consensus – the 97%. He is warning that many measuring systems, especially the satellite platforms, are headed for declines in coverage, which will lead to an information deficit. His worry is that straightened budgets will not allow replacement and hence continuity of information may be broken.

In a specific example, the Tropical Atmosphere Ocean (TAO) array, which consists of 55 oceanic moorings is involved in the detection, understanding and prediction of El Niño and La Niña, is only operating at 50%. Continue reading Climate clippings 80

Climate clippings 79

Climate clippings_175These posts are intended to share information and ideas about climate change and hence act as an open thread. This post has emphasised science, observations and impacts. Comments, about science, observations impacts, and future predictions are welcome. I do not, however, want a rehash of whether human activity causes climate change.

1. SAM and ENSO divorce

Roger Jones at Understanding Climate Risk has a post on global warming breaking the link between SAM and ENSO, with consequences for our weather.

To help, GMT in the graph means ‘global mean temperature’.

wang-cai-fig-3_500

With the global warming signal taken out (top panel), the relationship between ENSO and SAM is strong but with it in, they depart in the late 1960s (lower panel).

There’s also an article in The Age.

From Jones:

So what does this mean for Australia’s climate? It means that an overwhelmingly positive SAM is keeping the westerlies south and contributing to our drier autumn winters and delivering weather typical of the Riverina to southern Victoria according to Cai. Recovery of the ozone layer and reduction in greenhouse gas emission would stabilise this process, rather than continuing to send it south.

In summer it also allows the easterly trades greater access, bringing in more moisture from the tropics and enhancing La Niña summer rainfall. Continue reading Climate clippings 79

Climate clippings 77

Climate clippings_175

1. Antarctic ice melt studies

A recent study by Abram et al showed that the ice on the Antarctic peninsula was melting about 10 times faster than it was 600 years ago, concluding that further melting was particularly sensitive to temperature increases. The headline and the text of this story perhaps gave the impression that the whole continent was ready to go.

A more sober assessment was found at The Carbon Brief where the study was linked with another study by Steig et al that finds recent changes in the West Antarctica ice sheet “cannot be distinguished from decadal variability that originates in the tropics.”

Nevertheless Antarctica overall is losing mass (see also here). Antarctica contributed strongly to sea level rise during the Eemian and the Andrill study showed that “the West Antarctic ice sheet has collapsed and regrown over 60 times in the past few million years”. Any complacency would be misplaced.

2. New review of ice sheet studies

The Carbon Brief has also posted on a new major review of the latest research on ice sheets. The last IPCC report (AR4) relied on about 10 years worth of reliable sea level data, from 1993 and 2003. Greenland and Antarctica together were found to be raising sea levels by about 0.42 mm per year. That has now doubled to about 0.82mm per year.

So while we are still dealing with short time periods, a clear acceleration is in evidence.

3. Skeptical bloopers

The Carbon Brief reckons that once about every six months David Rose runs an article saying global warming has stopped. Here’s their post of October 2012. Then they lined up six top rebuttals of the week, and a reader contributed a seventh by Tamino.

It’s a tired canard and I didn’t bother reading them all. It did introduce me to the Met Office News Blog which has, for example, a very clear post on tornadoes.

Elsewhere in case you missed it Andrew Glikson debunks the notion that CFCs are responsible for global warming.

4. Garnaut recommends 17% target

Dr Jenny Riesz of the University of NSW reports on Garnaut’s recommendation to the Climate Change Authority which is currently deliberating on the Caps and Targets Review. He favours a 17% target by 2020 to put us in line with the US, Canada and other major economies.

At the Cancun United Nations negotiations in 2010, President Obama committed the USA to an emissions reduction target of -17% by 2020 (below 2005 levels). This has been somewhat ignored in Australia’s carbon targets debate, because policy to implement a national carbon pricing scheme to achieve this target was filibustered by the US Senate.

However, the USA remains committed to this target, both in spirit, and in writing with the UNFCCC.

Canada has promised to match the USA.

He suggests that the EU has found it much easier to meet their targets than originally anticipated, which is a typical experience. This, he says, is in part why their carbon price has collapsed.

Garnaut points out that:

the biggest change of all is coming from China, in terms of quantity of emissions reduction from business as usual. They have set truly ambitious targets, and are meeting them through a wide range of activities, including substantial structural change in the Chinese economy. These actions are driven by a wide range of objectives, including environmental drivers, desire for expansion of the role of services in the economy, and desire for more equitable income distribution.

5. Carbon trading schemes

In the last CC thread Jumpy linked to a Parliamentary Library paper Countries trading greenhouse gas emissions.

Over the last three years, the global carbon market has more than doubled in volume but almost halved in value. In that time a further eight countries, states or cities have adopted a carbon market as their primary means for reducing greenhouse gas emissions. Yet the price for one tonne of carbon dioxide equivalent has dropped by as much as 100 per cent in some markets.

That last sentence looks like an oops! A 100% drop gives you nothing!

The paper is the most recent of 25 on climate change in the past few years. In fact their blog Flagpost looks a valuable resource.

6. Floods in Central Europe

Dramatic floods have spread over central Europe.

The New Scientist reports caution about a link with climate change:

While it is premature to pin the heavy rainfall on climate change, it could be partly to blame, says Stéphane Isoard of the European Environment Agency in Copenhagen, Denmark. But he says bad land management is just as important.

Nevertheless wetter weather is predicted by climate change, making more floods inevitable.

Deutsche Welle goes into more detail, saying that while individual events can’t necessarily be linked to climate change, they’ve had once in a century floods now in the 1990s, in 2002 and now in 2013. We’ll have to expect more and prepare accordingly.

They make reference to Stefan Rahmstorf’s blog (which is auf Deutsch), but this paper is in English. On a quick look I think he’s saying they have found a mechanism linking floods, droughts and heat waves to climate change and if they are right expect more. And, yes they need money for research of the kind expended on the Higgs boson.

7. Interest grows in the Arctic

Now that the Arctic is increasingly becoming trafficable during the summer many countries are becoming interested. The politics of who sits where at the Arctic Council is complex, but China, Japan, South Korea, Singapore, India and Italy have now been admitted as permanent observers.

According to the New Scientist China is the one to watch. They’re interested in the Arctic as a shipping route, but also in fish and oil.

“It’s fair to say China will drive development of Arctic resources,” says Malte Humpert of the Arctic Institute in Washington DC.

The Arctic is fragile so we hope they take care.

8. US and China agree to cooperate on phasing out HFCs

From the White House brief:

For the first time, the United States and China will work together and with other countries to use the expertise and institutions of the Montreal Protocol to phase down the consumption and production of hydrofluorocarbons (HFCs), among other forms of multilateral cooperation. A global phase down of HFCs could potentially reduce some 90 gigatons of CO2 equivalent by 2050, equal to roughly two years worth of current global greenhouse gas emissions.

William S. Becker explains that China had always wanted to consider the issue in the context of the current round of climate talks, which would delay action, whereas the Montreal Protocol already exists. HFCs were introduced as an alternative to chlorofluorocarbons (CFCs) which were destroying the ozone layer. Unfortunately HFCs have a greenhouse effect like CO2.

Climate Progress has more detail and the AFP places this topic in context of the whole meeting agenda.

To provide further context HFCs amount to about 2% of GHG emissions, as shown on this wondrous flowchart.

Climate clippings 75

Climate clippings_175

1. The scientific consensus remains solid

Suzanne Goldenberg in The Guardian has the story. A study led by John Cook of Skeptical Science fame considered the work of some 29,000 scientists published in 11,994 academic papers between 1991 and 2011.

Of the 4,000-plus papers that took a position on the causes of climate change only 0.7% or 83 of those thousands of academic articles, disputed the scientific consensus that climate change is the result of human activity, with the view of the remaining 2.2% unclear.

The survey found that the consensus has grown slowly over time, and reached about 98% in 2011.

The study authors tell their story at Skeptical Science and the Guardian’s new blog.

Of the papers which specifically examine the contributors to global warming, they virtually all conclude that humans are the dominant cause over the past 50 to 100 years.

Continue reading Climate clippings 75

Oklahoma tornado and climate change

Tornado damage_cropped_300

The Courier Mail had quite a good piece. If you want pics the BBC has a gallery or enter Oklahoma tornado at Google images. There are some videos collected here. The Courier Mail has a large photo gallery.

Climate Progress revisits tornadoes, extreme weather and climate change. The bottom line is that the jury is out.

In the US tornado alley warm moist air flows north from the Gulf of Mexico in the lower atmosphere and becomes unstable. Dry, cold air comes from the west over the Rockies in the upper atmosphere, with a shear effect to create the top of the column. The warm air becomes unstable and lifts. The shear effect of the upper wind spins the rising column. More air is sucked in by the spinning, rising column. That’s simplistic but those are the basic elements as I understand them.

With climate change the lower atmosphere warm air flow and instability are likely to be enhanced, but there could actually be less wind shear. We don’t know what the result of those factors will be over time, but the suggestion is that if anything there have been fewer severe tornadoes over recent decades. Continue reading Oklahoma tornado and climate change