Category Archives: Climate Science

You’ve been warned!

I did have a restful Christmas, albeit wrapped in the warmth of Brisbane’s humidity, but in the still of the night reality has a way of breaking through. I’ll begin with the ending of this story, as it were, by quoting what Carl Sagan said about the photograph of Earth taken from Voyager 1 as it left the Solar System:

That’s here. That’s home. That’s us. On it everyone you know, everyone you love, everyone you’ve ever heard of, every human being who ever was, lived out their lives … Our planet is a lonely speck in the great enveloping cosmic dark. In our obscurity — in all this vastness — there is no hint that help will come from elsewhere to save us from ourselves.

Here’s the pic:

Voyager pic_4wq9db2n-1368400770_500

That’s from a article by Andrew Glikson done back in May as CO2 levels in the atmosphere of 400 parts per million were recorded by the National Oceanic and Atmospheric Administration.

Glikson highlights the changes this implies when the full effects become apparent, according to the paleo record when CO2 levels were similar in the Pliocene: Continue reading You’ve been warned!

Climate clippings 90

Climate clippings_175These posts are intended to share information and ideas about climate change and hence act as a roundtable for readers to contribute items of interest. Again, I do not want to spend time in comments rehashing whether human activity causes climate change.
This edition begins with a couple of items on extreme weather, but is mainly about solar electricity. Once again, thanks to John D for providing some links.

1. Snow in Egypt

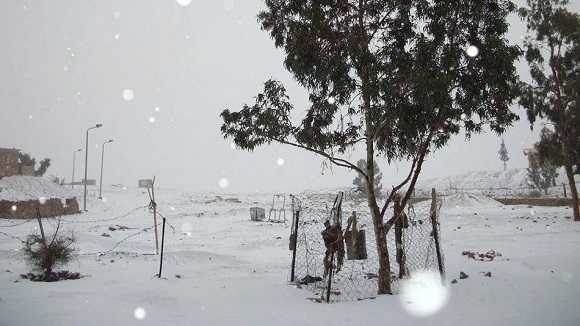
Recently snow fell across the Middle East, with pictures from Egypt, Israel, Syria, The Lebanon and Iran.

EGYPT-WEATHER

Conditions in refugee camps in the area must be horrific. Flooding was general throughout the area, including Gaza.

See more photos of extreme weather.

Lest you think global warming has gone away, November 2013 was the globe’s warmest November since records began in 1880, and the 345th consecutive month with global temperatures warmer than the 20th century average. Continue reading Climate clippings 90

Experts have a say on sea level rise

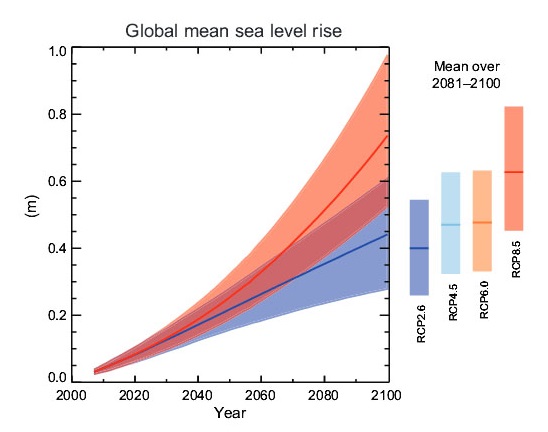
The recent IPCC report estimated sea level rise (SLR) thus:

SLR by 2100_cropped

For the scenario RCP8.5 (the most likely) the rise by the year 2100 is 0.52 to 0.98m, with medium confidence.

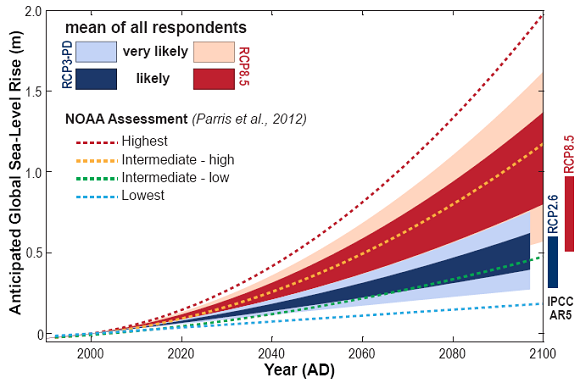
A new study (Horton, Engelhart and Kemp) asked experts in the subject for their view. For the RCP8.5 scenario they came up with 0.7 to 1.2m, as shown here:

Horton_SLR_Survey_580

Fully 65% of experts expect SLR greater than the IPCC forecasts.

The dotted lines on that graph represent NOAA projections of December 2012.

Meanwhile if, against the odds, we can hold temperature rise to about 2°C, then what happened during the last interglacial, the Eemian, has some relevance. This from the IPCC report: Continue reading Experts have a say on sea level rise

Real clothes for the emperor

“When I look at this [CO2] data, the trend is perfectly in line with a temperature increase of 6 degrees Celsius, which would have devastating consequences for the planet.” Fatih Birol, IEA chief economist

That’s one of the favourite quotes by Professor Kevin Anderson of Manchester University and the Tyndall Centre (personal website here) who, like James Hansen in the US and John Schellnhuber in Germany, is a leading climate scientist who speaks plainly about the dangers of global warming and the situation we’re in. Much of his important work seems to have been done with Alice Bows, now Bows-Larkin. In this piece I’ll refer to “he” or “they” depending on my perception of the source.

Real clothes for the emperor was the title of a talk Anderson gave to unionists in June 2013 (slides here).

Their basic point is that no real progress has been made since the Rio Summit in 1992 from which international action flowed through the agency of the UNFCCC and the IPCC. Policy makers in nations with ostensible targets seriously fudge the game so that economic growth is not inconvenienced.

Another favourite quote of theirs is:

“… dangerous climate change can only be avoided if economic growth is exchanged, at least temporarily [until low carbon energy supply is widespread], for a period of planned austerity within Annex 1 nations…” – Anderson and Bows, 2011

I’ll proceed by stating their main summary points in turn followed by a brief explanation. Continue reading Real clothes for the emperor

Climate clippings 89

Climate clippings_175These posts are intended to share information and ideas about climate change and hence act as a roundtable for readers to contribute items of interest. Again, I do not want to spend time in comments rehashing whether human activity causes climate change.

This edition is a mixture of science and implementation issues that found me rather than I found them. A couple came from Mark’s Facebook. The last item was drawn to my attention by John D.

1. Electric tents

If you want a tent for the holiday period that stands out from the pack and generates enough electricity to power computers, phones, cameras and loud speakers then
Bang Bang Tents is for you.

Bang Bang tents_cropped_500 Continue reading Climate clippings 89

Simple graphs tell a big story

John D drew my attention to RenewEconomy’s Graph of the Day: Nine simple charts to explain the global carbon budget. The post was originally published at Shrink That Footprint. There’s been next to no discussion at either place, but in my experience site stats show that a lack of comments doesn’t necessarily mean a lack of readers.

The graphs all come from the Global Carbon Project’s Carbon Budget 2013, which you can download here.

Here’s my version of the story in eight slides.

Please note that CO2 emissions are quoted as gigatonnes of carbon. Each GtC = 3.664 GtCO2.

1. Carbon emissions are still rising

In 2012-13 carbon emissions from fossil fuels and cement rose by 2.1% as against 2.2% in 2011-12.

Picture1_cropped_500

2. Emissions from coal continue to grow strongly

Emissions from coal grew at 2.8% as against gas and cement at 2.5% and oil at 1.2%.

Picture2_cropped_550

Shares of fossil fuel emissions are now coal 43%, oil 33%, gas 18% and cement 5%. Flaring at 1% is not shown. Continue reading Simple graphs tell a big story

Climate clippings 87

Climate clippings_175These posts are intended to share information and ideas about climate change and hence act as a roundtable. Again, I do not want to spend time in comments rehashing whether human activity causes climate change.

This edition picks up the theme of activism mentioned in Climate change: reconnecting politics with reality.

1. Blue sky

After the last election some friends of my younger brother, feeling blue, decided to turn blue into an optimistic colour, and invented the Blue Sky movement. To join all you have to do is ‘like’ the Facebook site put something blue on your front footpath visible from the road, take a photo and post it on the site. Yes, and take the Blue Sky Pledge, which includes reducing your own emissions, displaying blue for 12 months, and encouraging others to join.

Here’s one example:

Blue Sky_1395958_234410770055917_951721907_n
I notice that people have been using the site to share links.

If you click on “Community” or “About” at the head of the Blue Sky FB page and then click “more” you’ll get the full Blue Sky spiel.

2. Go Getup!

Ben Eltham thinks GetUp! is currently Tony Abbott’s most dangerous opponent. Continue reading Climate clippings 87

Cyclone Haiyan

dn24549-1_300Over the last few days we’ve received a stream of information and images about cyclone* Haiyan which devastated central Philippines, especially the city of Tacloban. Zoe Daniels compiled a graphic report for the 7.30 Report program last night. She mentions that they went to see a coastal village where the devastation was complete.

Here’s a photo from the SMH:

Hayan_ leyte169-408x264

Donations can be made through the Philippine Red Cross and Oxfam. Please feel free to post links to other charities in comments.

According to this link you can donate to the Red Cross by via credit card by phoning 1800 811 700. The hyperlink given there is broken.

Dr Jeff Masters’ Wunderblog has a post which reports the damage initially as $14 billion, breaking The Philippines’ record for damages for the third time in 12 months. Initial estimates of the death toll were put in excess of 10,000, but the SMH suggests the toll from Tacloban alone may have exceeded that figure. Some 9 million people have been affected.

The cyclone has been reported as the strongest ever to make landfall. An article in The Guardian quotes Jeff Masters as putting it at number four with the note that NOAA has stated that the maximum sustained winds estimated for typhoons during the 1940s to 1960s were too strong. The other three were in 1958 and 1961. In his linked post above Masters has compiled an unofficial top ten, with Haiyan at the head. Five of the ten were in The Philippines.

There are two aspects where I’d like better information. Firstly, I heard one report that the wind remained at Category 5 intensity for either six or eight hours (can’t remember which). The system was very large. Secondly, I heard of a storm surge of up to eight metres. Apparently this caused more damage than the wind and was responsible for many of the deaths. In many cases only the lowest areas were evacuated. Continue reading Cyclone Haiyan

Quicklink: Roger Jones on Bolt on Bandt

NSW fires_250Adam Bandt recently wrote an opinion piece in The Guardian suggesting a link between the NSW fires and climate change, then suggesting that the Abbott Government’s action, or lack of it, on climate change has real implications for loss of life. This incurred the displeasure of one Andrew Bolt who, inter alia, quotes or rather misquotes Roger Jones.

Roger takes a look at these doings at his blog Understanding Climate Risk.

It turns out Bolt is the one who is wrong, wrong, wrong. Oh, and a disgrace, but we already knew that.

Update: Roger Jones has two more posts up:

Fire and climate change: don’t expect a smooth ride

Backburning

Commentary on IPCC WG1: Part 2

In Part 2 of the round-up of commentary on the IPCC WG1 report I’ve tried to highlight where people have said something new or not emphasised elsewhere. I’ve not attempted to cover the MSM.

That’s it as a round-up. I plan to revisit particular topics later when the IPCC have finished fiddling with the text and layout.

The following image is the temperature projections representing the most optimistic and pessimistic scenarios. Bear in mind that RCP2.6 is probably hopelessly optimistic and at present we are tracking to do worse than RCP8.5. Also what happens is not likely to be as smooth as the graphs the models spit out.

Temperature_cropped_580

Here’s the link to Part 1.

The New Scientist has a special on the IPCC report which appears not to be paywalled at least yet. Among the questions asked is, can we be sure that any big issues have been missed?

Not entirely, is the answer given, but the text really says, yes, we can be sure. Anything that can’t be well-measured, such as the leaking of methane from permafrost, has been set aside. Also impacts with low probability and higher threat. So the report is restricted to the well-understood knowns and thereby conservative.

Science writer Michael Le Page distils a 10-word bottom line: we have to leave most fossil fuels in the ground.

He points to Norway to illustrate the problem. They get nearly 60% of their electricity from renewable sources and plan to go carbon neutral by as early as 2030. But they will do this by buying carbon credits with the earnings of their fossil fuel exports.

Doug Craig at Climate of Change picks up on the theme. Energy companies are currently spending $600 billion trying to find more fossil fuels.

The Conversation has tagged a topic IPCC Fifth Assessment Report Continue reading Commentary on IPCC WG1: Part 2

Commentary on IPCC WG1: Part 1

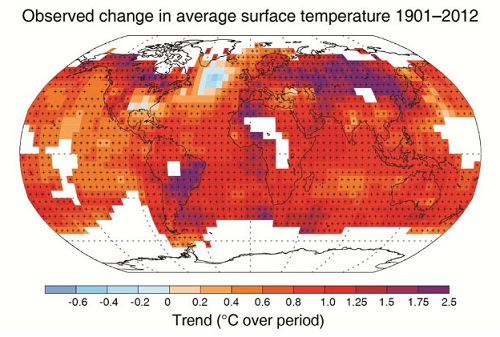
Warming_cropped_500

This is a wrap of some of commentary on the recent IPCC report. You can follow the links, or not, according to your needs, time and desires.

Climate Code Red carries a very clear summary of the report, which they got from Climate News Network, a handy site I wasn’t aware of.

The summary covers elements I neglected, such as Evaluation of Climate Models, but doesn’t go into the climate budget approach.

The post includes links to other commentary.

At RealClimate Stefan Rahmstorf solves the problem of the graph showing 82cm as the upper limit of sea level rise compares with 98cm in the text. It’s the last decade, the difference between 2080-2100 and 2100! Under RCP8.0 SLR will be accelerating rapidly according to forecasts.

George Monbiot is ascerbic as usual:

What the report describes, in its dry, meticulous language, is the collapse of the benign climate in which humans evolved and have prospered, and the loss of the conditions upon which many other lifeforms depend. Climate change and global warming are inadequate terms for what it reveals. The story it tells is of climate breakdown.

We need to leave most of the fossil fuel reserves everywhere, but for the corporations it’s full steam ahead, supported by their governments.

At ABC Environment Michael Mann and Dana Nuccitelli are in no doubt as to what’s causing global warming. The IPCC report:

concludes that humans have caused at least 50 per cent and most likely 100 per cent of the global warming over the past six decades, with external natural factors like the sun and internal natural variation like ocean cycles each contributing approximately zero to the warming during that time.

Ryan Koronowski at Climate Progress tells us 15 things we need to know about the report. For one thing Obama’s top science advisor said the report “represents the most comprehensive and authoritative synthesis of scientific knowledge about global climate change ever generated.”

And Stanford scientists Noah Diffenbaugh and Chris Field find that the current pace of warming is happening 10 times faster than any time over the last 65 million years.

John Upton at Grist pulls out the facts and figures. Grist also has an explainer about the IPCC. Continue reading Commentary on IPCC WG1: Part 1