NOAA’s annual State of the Climate report has recently been released, showing the climate change is proceeding apace on all fronts. The 300 page report compiled by 450 scientists from 62 countries confirmed there was a “toppling of several symbolic mileposts” in heat, sea level rise and extreme weather in 2015. From The Guardian:
- “The impacts of climate change are no longer subtle,” Michael Mann, a leading climatologist at Penn State, told the Guardian. “They are playing out before us, in real time. The 2015 numbers drive that home.”
Perhaps the best overview was at Carbon Brief with most of the important images.
Notable findings adapted from NOAA’s press release include:
- Greenhouse gas concentrations continued to increase reaching 399.4 parts per million (ppm), an increase of 2.2 ppm compared with 2014.
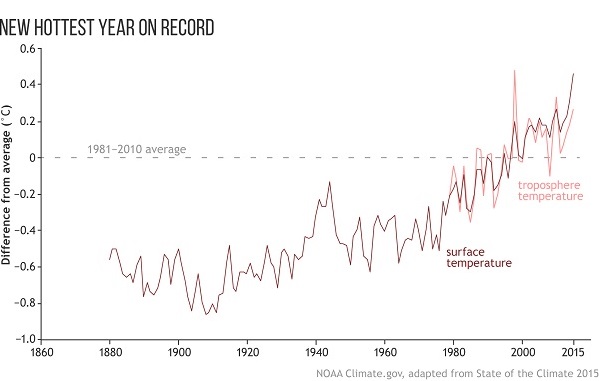
- Average global surface temperature was the highest on record, aided by the strong El Niño reaching 0.42°–0.46°C above the 1981–2010 average, surpassing the previous record set in 2014.
- Sea surface temperature was the highest on record breaking the previous mark set in 2014.
- Global upper ocean heat content was the highest on record. Upper ocean heat content exceeded the record set in 2014, reflecting the continuing accumulation of heat in the ocean’s top layers.
- Global sea level rose to a new record high in 2015, 70 mm higher than that observed in 1993, when satellite record-keeping for global sea level rise began.
- Tropical cyclones were well above average, overall. There were 101 tropical cyclones total across all ocean basins in 2015, well above the 1981-2010 average of 82 storms. The eastern/central Pacific had 26 named storms, the most since 1992. The North Atlantic, in contrast, had fewer storms than most years during the last two decades.
- The Arctic continued to warm. The maximum Arctic sea ice extent reached in February 2015 was the smallest in the 37-year satellite record, while the minimum sea ice extent that September was the fourth lowest on record.
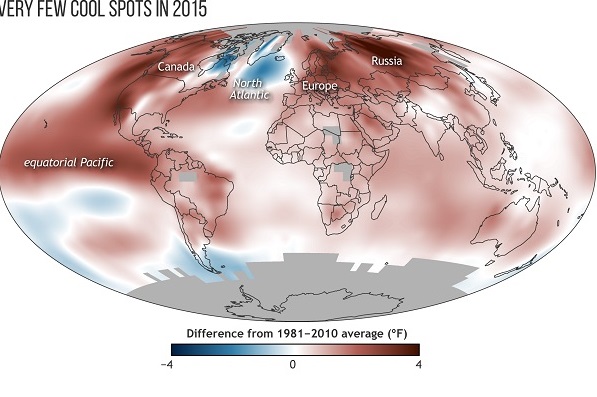
In addition, Dr Sarah Perkins-Kirkpatrick, a senior research associate at the Climate Change Research Centre at UNSW, spoke to Eleanor Hall about extreme weather experienced in 2015, notably heatwaves over Pakistan and India where thousands of people were killed, record-breaking autumns over Australia, extreme heat over Russia, heatwaves during Europe in summer last year.
- So basically everywhere, in terms of heat records, basically lit up like Christmas trees, and this is really concerning. There was a huge signature of this, and we looked at the hottest daily temperatures, and also a signature when we looked at how hot night time temperatures were as well.
So yeah, that’s what really sticks out for me, that basically everywhere was extremely warm at least for some part of last year.
Here’s the heat map via Carbon Brief:

Here’s the graph:

Wildfire seasons are bad and getting worse.
George Monbiot says the climate crisis is already here, but no-one’s telling us about it:
- The media largely relegate the greatest challenge facing humanity to footnotes as industry and politicians hurtle us towards systemic collapse of the planet.
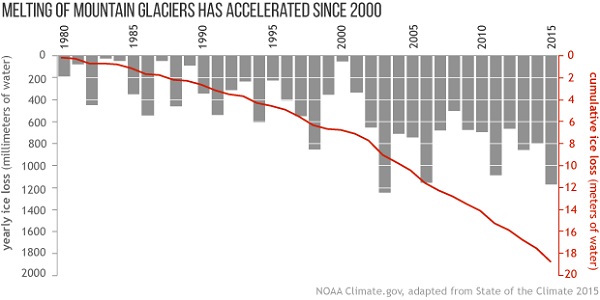
This site provides some highlights of the report. If you click on the graph in the top row you come to a story about mountain glaciers. This graph shows the average annual net water loss of 41 reference glaciers from 1980 to 2015:

Summer melting and evaporation have exceeded winter accumulation every year on average for 36 straight years. The red line shows the cumulative melt, which is now 18.8 metres and in 2015 was 1.162 metres.
The effects of global warming are becoming very obvious to anyone who occasionally looks up from their tablet.
Th full 300-page report is here.
