A claim has been made that that the ALP had the best terms of trade in history and blew it. The short answer is the terms of trade were certainly good back in 2011 when Wayne Swan tried to bring the budget back into balance, perhaps the best ever, but they turned sour and blew his budget ambitions away.
Trading Economics makes the statement:
- Terms of Trade in Australia averaged 67.12 Index Points from 1959 until 2016, reaching an all time high of 118.50 Index Points in the third quarter of 2011 and a record low of 49.30 Index Points in the fourth quarter of 1986.
It’s just that the Parliamentary Library showed a graph which has the terms of trade at 120 in 1963, and over 130 in the early 1970s.
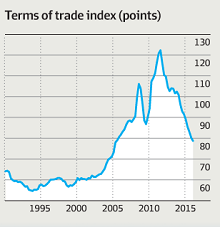
Certainly they were at a long time peak in the third quarter of 2011, as shown in this graph:
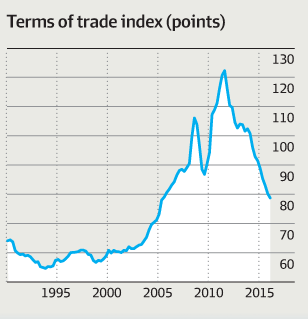
That was sourced from the CBA, and I got it from this article in the AFR, and also an article by Laura Tingle.
As the Parliamentary Library says, “the terms of trade is calculated as the ratio of export prices to import prices.” If you look at the accounts of BHP Billiton you’ll find that their net profit in 2011 (year end to June) was $22 billion. In 2012 it was $15.1 billion, and in 2015 only $2.48 billion. Rio had a net profit of $14 billion in 2011. In 2012 that fell to $5.7 billion, and in 2015 they booked a loss of $1.18 billion.
Both companies paid fully franked dividends, which means that tax was taken off the top of their actual profit to give those figures. So revenues from these and other companies fell by many billions. My mathematics (subject to confirmation) shows that the tax revenue alone from those two companies fell by $6.5 billion from 2011 to 2012. Treasury would have forecast an increase.
I leave aside the attempt to cream expected super taxes with a mining tax, but the fact is that the mining tax stream was rapidly evaporating.
The next image shows the deterioration in official expectations between the 2012 and the 2013 budgets:
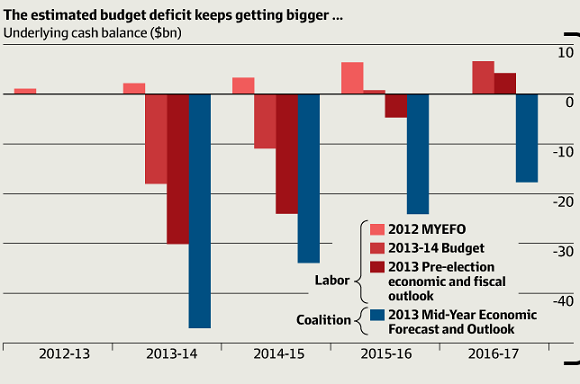
In 2012 a surplus looked attainable. With the change in the terms of trade it got pushed out to a five-year exercise, where it remains, whether we vote for Labor or the LNP. The difference is that the LNP is relying on spending money to give to companies to improve the economy through trickle-down economics, while Labor has introduced more revenue saving measures, such as the negative gearing and capital gains changes, which will largely take effect after the 4-year budget period.
Labor’s savings start lower and end higher for good logical reasons in a story that can only be told over 10 years. The Coalition has selective 10-year stories when it suits them.
We know that budgets after the current year contain uncertainty, because the economics world is governed by largely unpredictable events, but it would be irresponsible not to look to the mid-term future of changes made now. Companies deal with a 30-year horizon, we are told. Four-year budgets are not in the constitution, rather they were introduced by Keating. In future I’m betting the trend will be towards 10.
The next image shows the budget balance over the years. It’s from MYEFO, the mid-year revue last December:
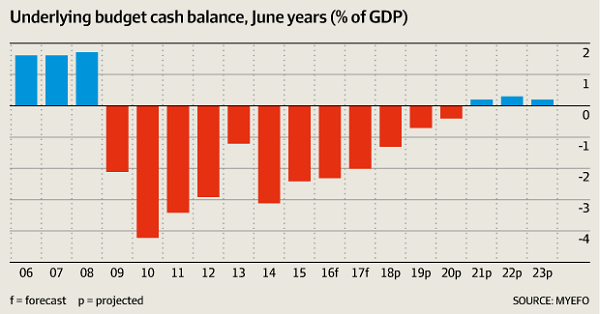
Three comments. Firstly, the large deficits in the GFC response not only saved Australia from recession, it constituted a catchup in infrastructure spending, neglected by Howard/Costello in favour of tax cuts, middle class welfare, and tax avoidance schemes for the rich using superannuation. I think there was a libertarian philosophy behind this, which, taken to its extreme, would have turned the street in front of our houses into a toll road. Every individual was to become a business centre.
A longer view of the deficit position is here:
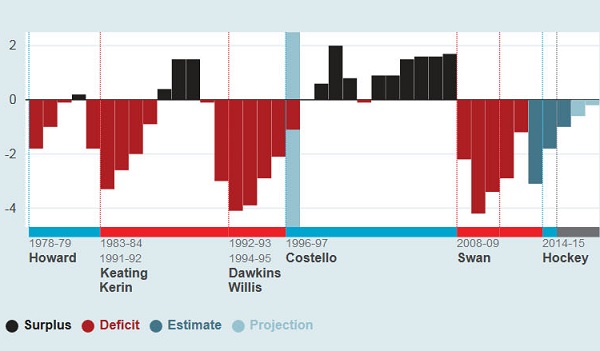
Costello pissed the rising tide of revenue up against the wall, apart from the Future Fund, a good idea but far too late and too narrow.
Secondly, the earlier graph shows how ambitious Swan was in trying to get the budget back to balance in 2012 from the 2011 position, and the progress he still made to 2013 in spite of the sharp change in the terms of trade.
Thirdly, it clearly shows how Hockey enlarged the deficit, Shorten says it was trebled. Against what would have been the forecast, that looks about right. Certainly the LNP habit of blaming everything on the Labor mess left to them is rank hypocrisy. Still I have some symapathy for the cards they have been dealt, as shown by the recent terms of trade:
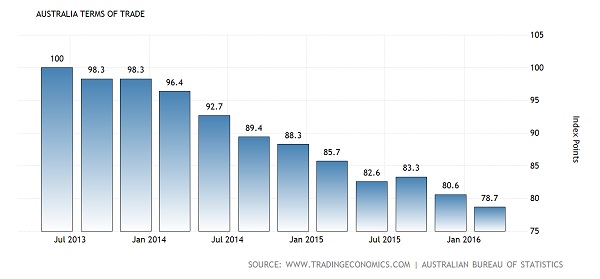
They are still deteriorating. (BTW 100 is the terms of trade for 2002-3.) ScoMo is wrong when he says there is no revenue problem. The taxpayer is getting next to nothing from mining company profits, although gas and other minerals may be yielding something. CVoal seam gas is coming on stream. Presumably the workers pay tax, and there are royalties to the state. Essentially, however, we are giving our major minerals away.
Jumpy makes the claim that we maintains its standard of living with our net exports.The Parliamentary Library piece says:
- Australia is heavily dependent on trade for its economic well-being.
Trade accounts for about a fifth of our economy, but economists will tell you it is hugely important what we do in the other 80%. Mostly we trade with each other.
Which brings me to Jumpy’s statement about GDP which provided the context for his calim:
-
GDP = C + G + I + N
C is equal to all private consumption, or consumer spending, in a nation’s economy, G is the sum of government spending, I is the sum of all the country’s investment, including businesses capital expenditures and NX is the nation’s total net exports, calculated as total exports minus total imports (NX = Exports – Imports).
That turns out to be pretty much a lift from Investopedia. Or a similar site. Please understand that it is not good etiquette to copy material without acknowledging the source.
In the AFR articles linked above, this graph gives the last quarterly account of GDP:
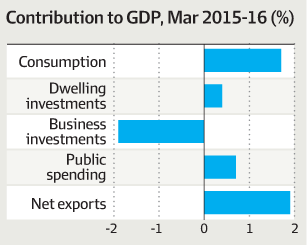
It has the refinement of separating out dwelling investment from business investment.
Laura Tingle’s article about it adds a third graph:
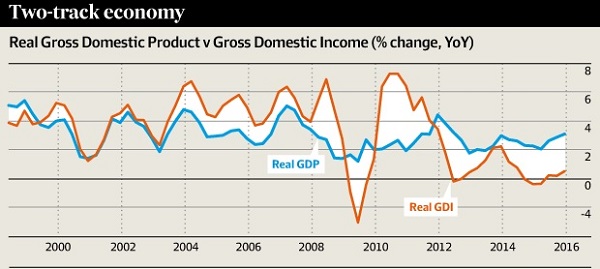
The terms of trade problem means that we are getting little income from mining, and some of the profits are going overseas. Tingle says:
- Living standards shrank 2.6 per cent in the 15th straight quarter of falling or stagnant real net national disposable income per capita.
And:
- Net exports were almost entirely responsible for the good growth figure.
As another confirmation of the transition within the resources sector from investment to output, there was a huge rise in shipments of iron ore and coal exports. ‘Volumes’ are going through the roof.
It’s just a little sad that plunging commodity prices means we are almost giving the stuff away and not enjoying an income boost from all those big mining resources projects finally coming on stream.
I’m not sure how much the Government can be held responsible for the current situation, but a little honesty from them is a necessary condition for an intelligent discussion of policies. It seems to be beyond them.
Meanwhile, a few interesting facts were turned up in Chris Bowen’s speech on February 2014:
- During our period of government, Australia’s GDP per capita, which is the real measure of prosperity, rose from a ranking of 17th to eighth in the world. We jumped three places to go from being the 15th biggest economy in the world to being the 12th when we handed over office.
In spite of the challenges of the GFC and deteriorating terms of trade, they did OK.
As Tim Dunlop explained in March last year, the myth of Coalition economic management lives on although it doesn’t accord with history.
On deficits, can I just say to those who favour such analogies, a company that had no debt would be seen by the market as having a lazy balance sheet and no vision for the future. That’s Howard/Costello right there, or the vision is a libertarian one. The norm is to have borrowings of from 30 to 60 percent of earnings. I don’t think the analogy is entirely apt, but it’s food for thought.
We have repeatedly been told that Australia has depended on foreign capital for investment. One policy choice we have made is to privatise superannuation investment. We have a respectable pool of savings there, but in private hands where some other countries have a sovereign wealth fund. I’m not saying our way is better or worse, but it is what it is and is unlikely to change. In fact some of those funds are invested overseas and earn us foreign money.

Please clarify that as it makes no sense.
Or if you lifted it, please link.
No, but you can invest in the largest debt companies if you wish.
Companies can reduce their outgoings by using debt repayments to offset profits and rightly so. Countries can not, so debt repayments are an opportunity cost to the citizens.
There is also very few obstacles in migrating to the largest debt countries, quite the contrary.
Jumpy I didn’t lift anything but have heard economists say it many times. The vast amount of our economic activity is accounted for by goods and services we exchange with each other, without involving foreigners.
There is a huge amount of discretion in how we structure our economy, our politics and our society, the regulations and laws we live by, what we like to spend our time on here, how we help the disadvantaged and the privileges we allow to the rich.
These have a massive impact on our well-being, which is the measure some try to use instead of the GDP.
That’s all I’m saying, or as the song says:
and:
Jumpy, I don’t understand that. Surely companies use debt to invest in new ventures to make money. The interest on the debt is an outgoing which detracts from profits, but presumably increases revenue, and profits, at least in the long run.
There are opportunity costs in government not using debt. My favourite example is the Story Bridge which cost ₤1,150,000 and opened in 1940. It was tolled umtil 1947, and if memory serves was finally paid off 50 years later in 1997.
You will also find economic justification for things like play-based preschool, disability services and money spent of mental health, all of which return every dollar spent many times over. You could justify using debt to fund that sort of thing, but people usually don’t, rather they justify paying taxes.