There is no doubt that electricity in Australia has become expensive. Here is a graph on the National Electricity Market (NEM) states, other than Tasmania, against European countries:
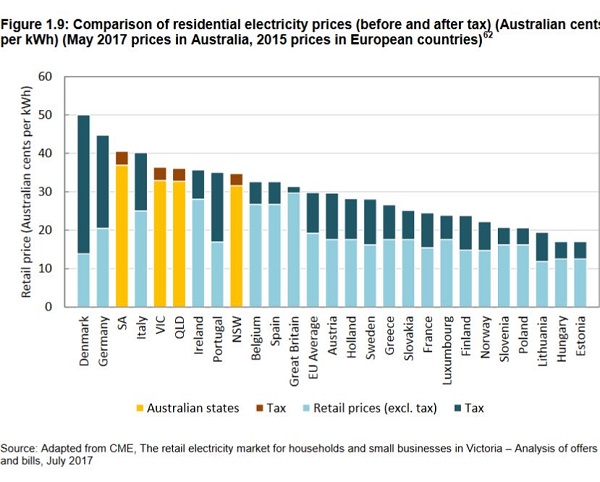
It’s from a Carbon + Energy Markets report cited by the ACCC Retail Electricity Pricing: Preliminary Report, September 2017 comparing May 2017 Australian prices with 2015 European prices. The ACCC also note that:
There are currently no national surveys conducted in Australia that inform price reporting around what customers are actually paying.
Which is disconcerting. The one above was based on the weighted median offer of the three largest Australian retailers.
The first take-out is that when you see graphs representing electricity prices, attend to the fine print, but what you see may still not represent reality.
This one comes from the OECD, sourced from the IEA, who probably got it from a consultant:
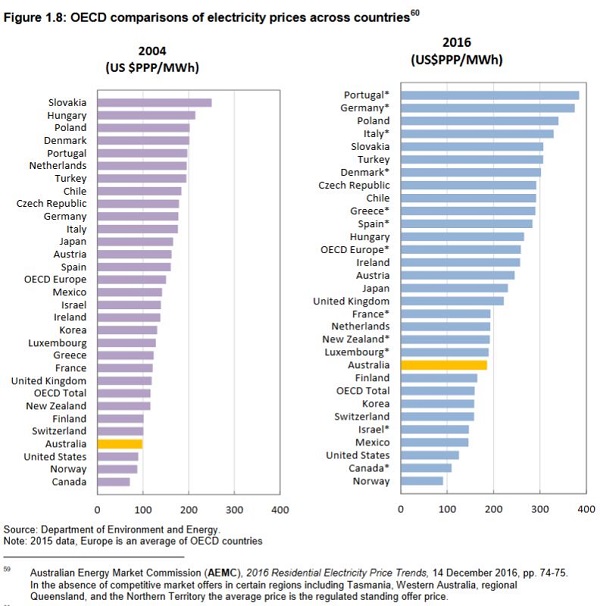
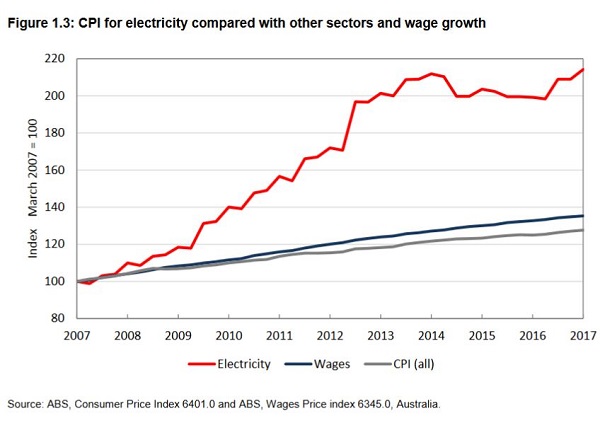
The ACCC has reservations about the methodology and preferred the Carbon + Energy Markets graph, but the differences are startling. While there can be no accurate graph compiled in Australia, the ACCC believes prices have risen by 63 per cent in cents per kWh between 2007–08 and 2016-17. And this is what it looks like in the overall:
This is what it looks like in terms of capital cities of the NEM:
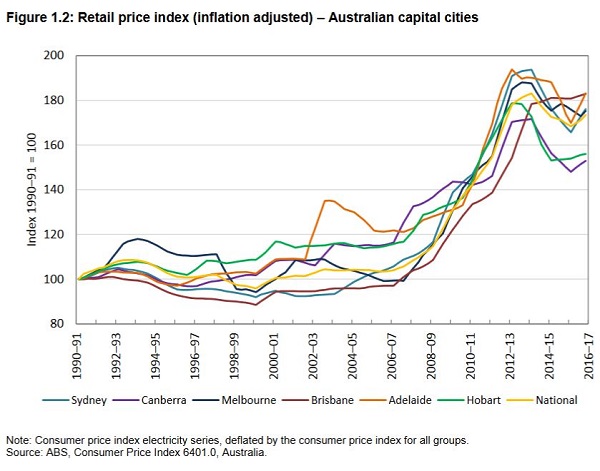
Those appear to be from the ABS. Brisbane is lowest and then at the end becomes the highest. However, I could show you others where Queensland is the lowest. For now, here are the spot prices:
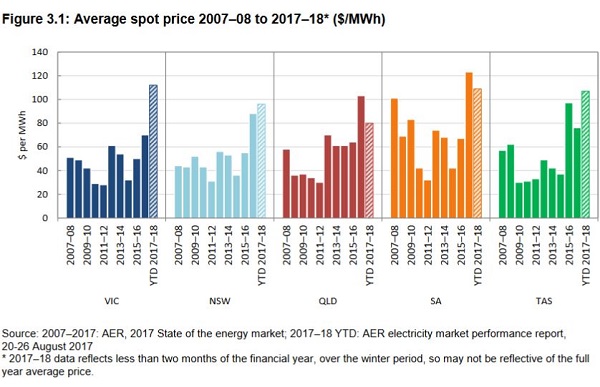
Somehow Queensland ends up lowest. The last bar is for the first two months of 2017-18, but this one from RenewEconomy shows Queensland tracking low from April to June:
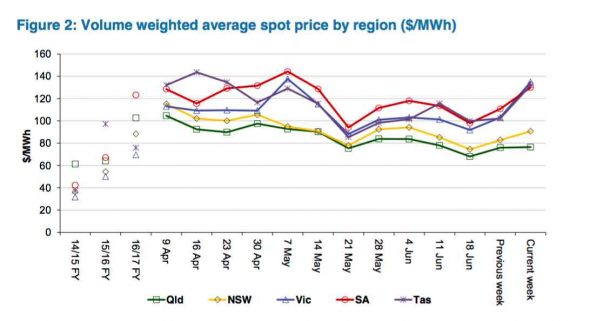
I think that came from the Australian Energy Regulator.
And then the AFR has these prices for the last four months:
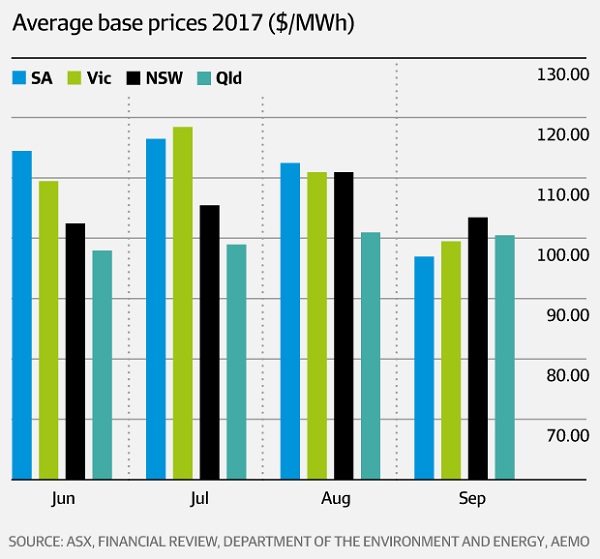
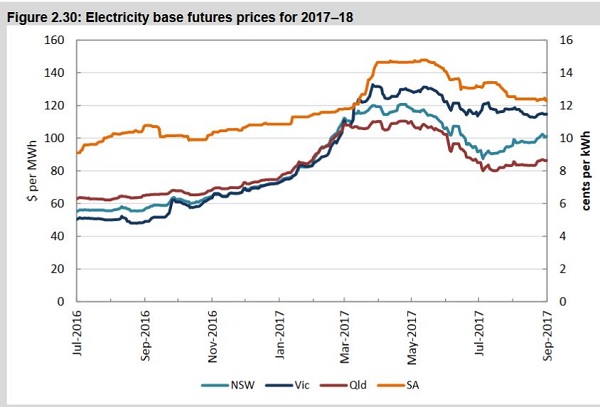
Miraculously SA and Victoria go from high to low in September, but Queensland is edging up. However the future in Queensland looks particularly bright, according to the ACCC:
I’ll pick up the issue of price later, but a large focus in the ACCC report is on affordability. Here the size of the bill matters, as does the consumer’s ability to pay. This graph represents affordability by state in terms of the percentage of household income that goes towards the electricity bill:
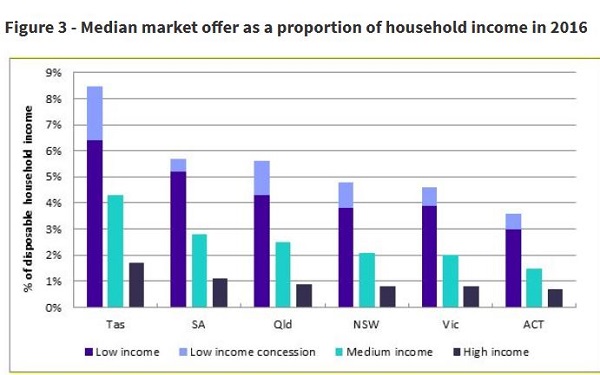
However, this graph may be compromised if the figures in the report for each state are wrong. Below I have questioned the figures for Queensland.
Here is the cost stack of each state showing the contribution of the components of the bill:
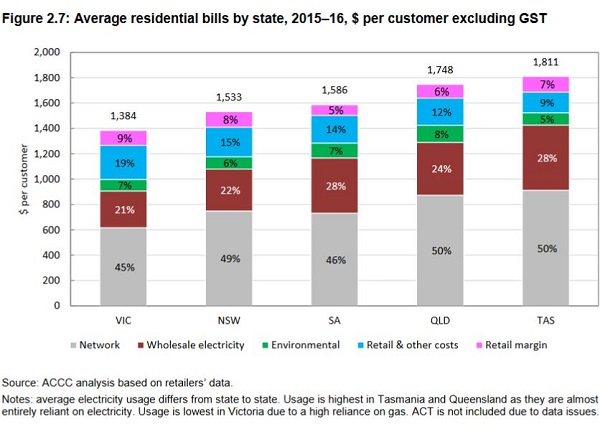
Just a few points to bear in mind. It was 2016, and Tasmania had a hard time when the interconnector to Victoria was out of play and a dry winter affected their hydro, which supplies most of their electricity.
Victoria uses a fair bit of gas for heating, cooking and hot water, so uses less electricity per household.
Qld are top users along with the ACT. I would presume this is because of the need for airconditioning in the summer. It seems the modern mega-mansions being built are airconditioned throughout.
In SA there is no coal-fired power, so gas represents a larger percentage of their generation, and their gas is the most expensive. In terms of generation capacity Queensland has the most:
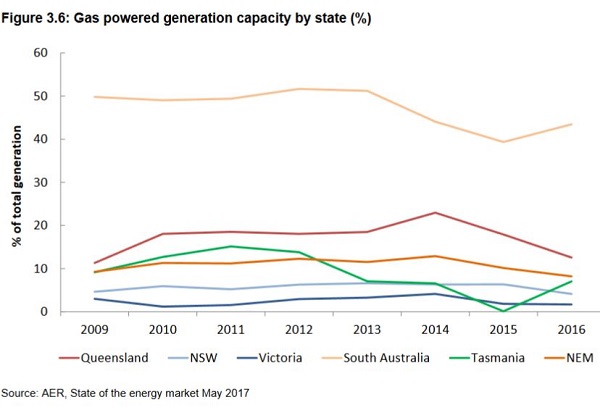
Queensland is the generator of last resort in the NEM which has increasingly had to turn up the gas. This created high spot prices over the summer months, which blew the lid on February 10 with rolling blackouts.
I understand the the foreshadowed closure of Hazelwood was reflected in Queensland spot prices before it actually closed. Ironically when the re-opening of Swanbank E was announced in Queensland, future prices fell. Since generators use hedging, this put downward pressure on Queensland prices because even though there would be more gas used the spot market would be less volatile.
The following graphs show the importance of Queensland within the NEM, and the virtual irrelevance of South Australia. This one shows average maximum daily demand in the NEM states in the summer:
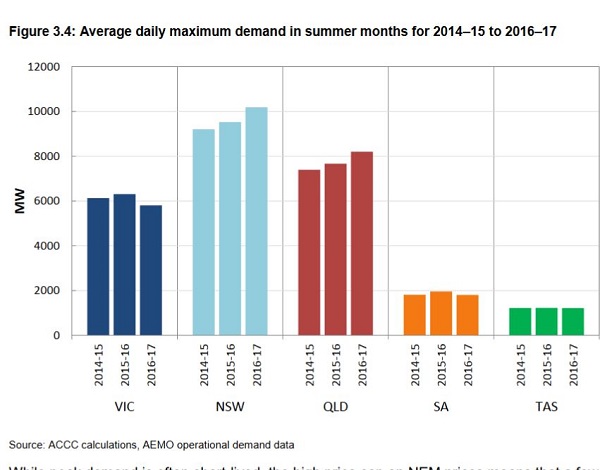
Notably, demand is rising a bit in NSW and Queensland, while it is flat or falling elsewhere. I read somewhere (brokers report on AGL, I think) that demand in Victoria was down 4.5% yoy for the last quarter.
Elsewhere I pointed out (stats from Wikipedia) the relative populations – NSW at 7,838,000, Victoria at 6,291,000, Qld at 4,908,000, SA with 1,721,000 and Tasmania with 520,000.
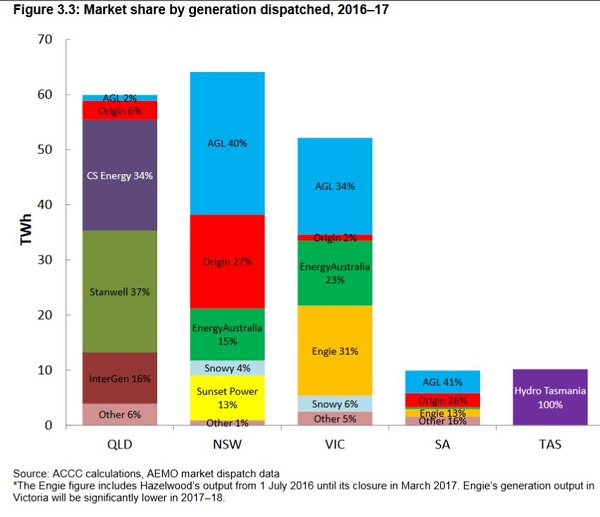
Here again is the energy generation by state from ACCC:
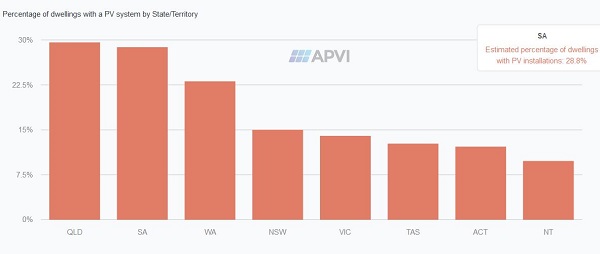
Rooftop solar is becoming a significant factor, ignored by the ACCC. South Australia is second only to Queensland in Rooftop PV penetration. Here are the figures:
Here is the installed capacity:
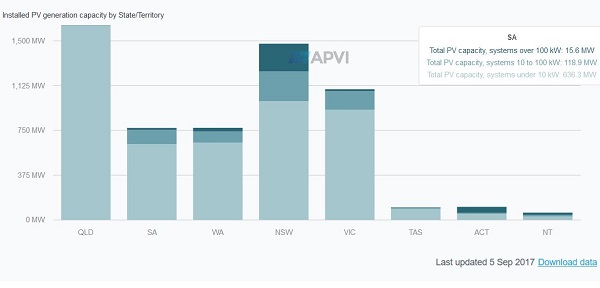
The light blue shows installations up to 10 KW. The total of this small solar in SA in 636 MW, which is quite significant in their context.
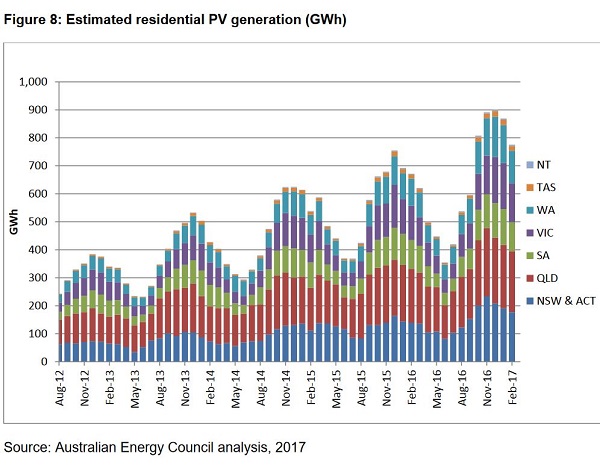
The Australian Energy Council’s Solar Report, March 2017 shows how residential PV generation is tracking:
That document has a graph of residential electricity bills, sourced from the Australian Energy Market Commission 2016, quite different from those in the ACCC. For example it has Queensland 2016-17 bills at $1380, whereas the ACCC has $1955. The latter has network charges at $843 per annum, whereas our bill in the first quarter of 2017-18 shows clearly $1 per day, plus GST and before discount for paying on time. It just does not compute.
[Update Apr 2018: Hugh Grant tells me that the fixed fee shown on my bill as “supply charge” does not represent the total of the network charges. There are both fixed and variable network charges on the bill – and the total network charges will amount to a total of around 15c/kWh dependent upon annual consumption.]
I think this table showing increases in percentage terms is accurate:
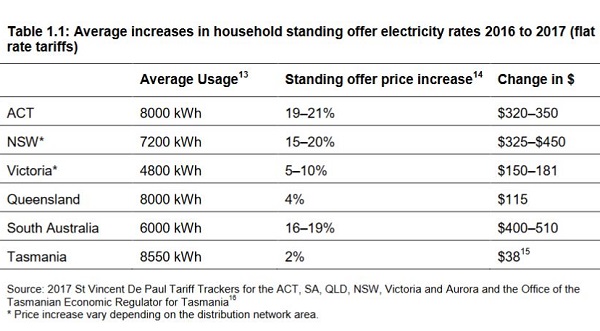
The 4% for Queensland should be 3.3%. Near enough, but if you divide $115 change by four and multiply by 100 to get to get annual base figure you get $2,874. The true figure of 3.3% makes the annual figure even more ridiculous.
As I outlined in Queensland powers up for a warm summer the Palaszczuk government has taken a number of steps to contain electricity prices. As I mentioned in that post, local ABC Mornings host Steve Austin was missing the story about PeakSmart, remotely turning down (ie. up in temperature) aircon in heatwaves, and basically set up energy minister Mark Bailey for a free hit by opposition spokesperson Scott Emerson.
Then (see my comment of 9.28am on October 24) he quite astonishingly invited Josh Frydenberg to tell us about Queensland’s Affordable Energy Plan half an hour after Mark Bailey had held a media conference. Obviously neither of them had seen the media release. It had quite a few components, but all that got through to Steve was the $50 cut in the bill over the next two years.
Honestly, it looks like revenge on Mark Bailey for not coming on his show. It makes a nonsense of ‘balance’ in reporting.
The next day there was a subsequent announcement Stopping LNP electricity privatisation lowers electricity prices: study. This time Austin called upon Matthew Warren the Clean Energy Council CEO, but again they both missed the story. From memory, this time they focussed on Palaszczuk’s threat to set up a government retailer if retailers did not pass on government savings initiatives, which to them comprised only the $50 cut.
Hugh Grant
[Update: I have spoken to Hugh Grant about the following segment. He has clarified where I have misunderstood what he said, and where I was plain wrong. I’ve inserted updates at the relevant places. However, most importantly, I now regard him as perhaps the most knowledgeable and informed analyst I have seen or heard, including those which appear in RenewEconomy, and apologise for the direct attack on his credibility below. We should hear more from him.]
On the following day Austin introduced Hugh Grant of ResponseAbility (segment available here), who had worked inside the electricity industry until 2009, and since had performed diverse functions, including being a member of the AER’s Consumer Response Panel. He certainly had impressive knowledge of the industry, and was put forward as the one to guide us as to which party would give the better deal on electricity in relation to the forthcoming election.
Grant said that the Government drew a profit from the electricity industry in the form of dividends, state tax, competitive neutrality fees and equity drawdowns. This, he said amounted to $3 billion pa, of which $2 billion was dividends.
In addition, private retailers and generators in Queensland made some profit. His calculation was that of the average annual bill of $1750 per household, $600 of that was profit, $500 to government and $100 to private companies. So the $50 cut was only giving back 10% of the government profit, which, of course, was spent on frivolous things like teachers, nurses and coppers on the beat. He didn’t say these were frivolous, but there was much shock-horror at the quantums involved.
He reasoned that the LNP mob would do the same, so there was no difference between the parties.
[Update Apr 2018: I did get that impression from what was said. However, Grant did a more complete comparison of the political offerings which you can read here published three weeks after my post, or listen to the excellent interview with Kelly Higgins-Devine on 27 November, a month after my post. The first 8 minutes of that interview comprise an exposition of the various political party policies. The questions that follow add value. The differences between the LNP and Labor were seen to be substantial.]
I have several comments. Firstly, he did mention that in 2014-15 the government take was $5 billion. However, no mention was made attributing that $5 billion take to the Newman government, under whose administration according to Labor, and it’s probably true, electricity prices rose by 43% compared to an average of 1.9% per annum under Labor. This claimed fact should really have been highlighted and examined. In any case the current government was already taking 40% less than the previous government. This was not mentioned at all.
[Update Apr 2018: I’ve listened to the interview with Steve Austin again. I believe Grant said that the amount taken by the government was $5 billion in 2014 and 2015. In other words the first budget under Palaszczuk did not reduce the government take.]
Secondly, no mention was made of the fact that there would be similar profits in other states, which would go to private enterprise. And we should remember that the LNP did propose to sell the electricity assets by way of a 99-year lease. It was one of the major reasons they did not get elected.
Third, the $1750 average equates with the ACCC 2015-16 figure, so it was a year out of date.
[Update: If you do a calculation from the Acil Allen table below it infers an average bill of around $1300. I now have four sources that put it in 2016-17 at about $1300 to $1400. The ACCC report has it at $1955. Please note that the ACCC got its information from secondary sources, not by surveying actual bills. Seems they are wrong, making Queensland bills about the cheapest. 29.11.17]
[Update: Fourth, we are in the 21st century, and we need to compare the ALP policy which is transitioning to renewables, and the LNP which will withdraw all support and build new coal. It is reprehensible in making this comparison to simply sweep the issue of climate change under the carpet. The ABC needs to join science and get off the fence on climate change. 29.11.17]
Finally, and most reprehensively, Grant obviously knew nothing of the government announcement Stopping LNP electricity privatisation lowers electricity prices: study made two days earlier.
I’m sorry, if you introduce someone as an expert able to make a definitive judgement between the major parties prospective performance on electricity costs, then you must be up to date. Especially as the missed announcement was directly material to the issue as I now relate.
[Update Apr 2018: I withdraw the above attack on Hugh Grant’s credibility unreservedly and apologise. Grant tells me he had read the government announcement about the Acil Allen report. I took it as an announcement of electricity bill reductions. If so, it was not reflected in what has happened this year. In our standard offer in 2018 , which was virtually the same as a competitor we checked, the fixed service charge has increased by 11.6%, and ‘Tariff 11’ usage charge has increased by 5.6%. However, we have been given the $50 discount promised by Labor, and a 28% discount on ‘usage’ in return for setting up direct debit settlement. I thought the media release was an announcement of something that was going to happen. Seems Grant, who has been around the issues at depth for years, recognised it for what it was – more about politics than policy. The fact is, though, that if Steve Austin had been up to speed, he would have raised the announcement with Grant. He didn’t.
There is also the possibility that Jackie Trad as treasurer took a different view from that of her predecessor.]
The Queensland government had recently taken a range of actions to bring down prices. It turns out that these actions were not taken into account in the Queensland Competition Authority’s price determination early in June, which becomes the residential price charged by Ergon in country Queensland, and the standard offer by retailers in SEQ.
No doubt it contains a profit deemed reasonable to retailers. However, the retailers were simply trousering the cuts made by government. So the government turned to Acil-Allen, the modellers who do the work for the Queensland Competition Authority in setting the price. The study assessed the price implications of the following Government decisions:
- directing Energex and Ergon Energy (Ergon) not to appeal the Australian Energy Regulator’s (AER) determination
- Powerlink to not appeal the AER’s determination
- removing the costs of the Solar Bonus Scheme from network tariffs
- recommissioning Swanbank E gas-fired power station and directing Stanwell Corporation to adjust its wholesale market offers in order to lower wholesale prices.
The link at the bottom of the media release takes you to the study Retail Bill Impact Analysis: Quantifying the Impacts of Recent Government Actions. The results are captured in this table:

Here is how the amounts are broken up:
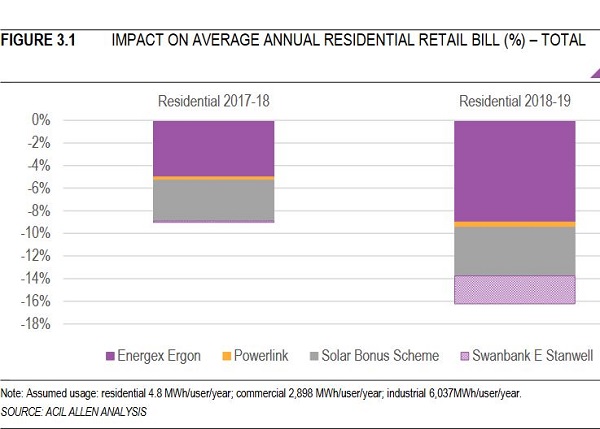
Please note here that the impact of the direction to Stanwell to alter its bidding practices is calculated as 2%, including the effect of re-opening Swanbank E, not the 25% difference cited generally and which Grant said was the immediate effect on the wholesale futures price.
For the first time we have some information as to what that direction to Stanwell was about. Most have assumed that it related to rebidding, or manipulation of the spot market during the summer, although this claim had been investigated by the AER and found to be related to the failure of five coal generators in the heat and a consequent shortage of supply and rolling blackouts.
It’s still not entirely clear, but what I take from the report is a lean hedge book carried by Stanwell, and a tendency, as in New South Wales to pitch their coal-fired bids to shadow the price of gas-fired bids.
The bottom line is that the government is effecting cuts of 16.1% of the whole average bill. Retailers are being made to agree in writing to pass that on and to show it on the bill. It’s one way of communicating the message if journalists and experts don’t read the media releases.
The savings are to be $146 in 2017-18 and $210 in 2018-19, not $50.
The final point, however, is that if you do the numbers on a 16.1% cut quantified at $210 you get an annual average bill of $1304. That conforms with the Australian Energy Council information above, but not the ACCC. I think Acil-Allen are working in the real world with real information doing a real job under supervision. I can’t begin to know how the ACCC went about information gathering, but it looks seriously wrong.
This post is not an evaluation of the ACCC report, and leaves out the causes of the price rises and the impact on business and industry. However, it shows that Queensland with a high degree of government ownership has performed well compared to the other states. Moreover, it raises serious questions about what can be done by rational action when a government owns the levers to pull, as against more and more free market competition activated by the profit motive.
Update: Perhaps, in the light of comments below from John D and BilB I should have posted this graph of the Queensland residential bills for 2016-17:
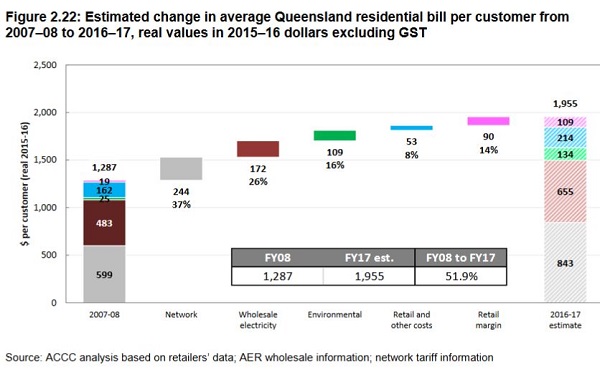
I want to make it clear that I’m disbelieving this graph on two counts.
Firstly, on our electricity bill in front of me for the quarter ending 15 September 2017 it says that the supply charge goes up from July 1 from $0.8957 per day to $1.00 per day, a fair hike, but it leaves us with $365 pa, to which GST is added, but we get a discount taken off the end of 14% for paying on time. But the standard offer is $401.50 pa, which is a long way short of $843.
The only other substantial charge is the usage charge, which is currently $0.26 per kWh. I know that it is said that you can now put solar on your roof for $0.19 per kWh, but that depends on a lot of stuff like the orientation of your roof, the pay-back period and how long you anticipate staying.
For the sake of this argument that is by the by.
The second problem is that information from the Australian Energy Council and Acil-Allen indicate an average bill of a little over $1300 pa, not $1955.
Until these anomalies are resolved no useful generalisations can be made on information in the ACCC report.
Update 2: I’ve done another set of calculations based on a network charge of $0.8957 per day, which was the charge in 2016-17. That gives us $326.93 pa or $359.62 with GST. That is about $483 less than the ACCC figure of $843.
If you subtract $483 from $1955 the corrected bill per annum becomes $1472.
Network charges of $359.62 represent 24.4% of the annual figure.
I’ve heard that the industry was less than completely forthcoming with the ACCC, which may explain why, but there seems to be a major balls up in the figures.
I’m very happy to be proved wrong, but meanwhile must run with the concrete evidence. I can’t change the figures on my bill in black and white in front of me.
Update 3: I’ve had a quick look at the Thwaites inquiry, the Independent Review into the Electricity & Gas Retail Markets in Victoria.
It looked at household costs by studying actual bills in categories according to how much they used. Here is the disaggregated average bill for 2016-2017:
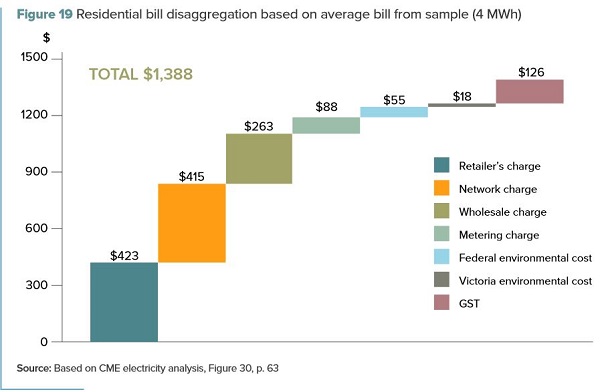
That is for households using 4 MWh pa.
Actual electricity forms about 19% of the bill, network charges apart from metering about 30% and retail also 30%.
Here is the most comparable graph from ACCC:
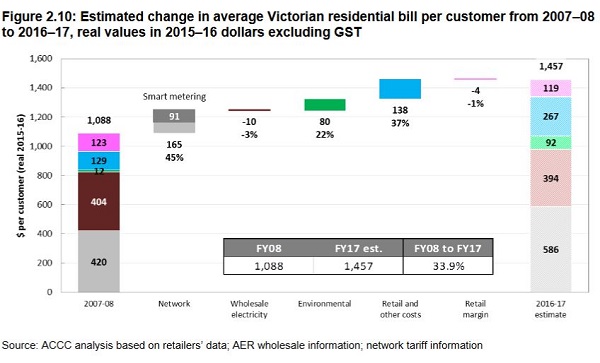
The ACCC has used information from the retailers, AER wholesale information, and network tariff information. It averages the usage on table 1.1 at 4800 kWh.
I’ve highlighted the word average because Thwaites elsewhere compares average bills to median bills from each retailer. Median bills in most cases are more than 10% less than the average. I suggest that median should be taken to mean typical.
In Victoria there was a program of compulsory issue of smart metres, which end up in network costs in the ACCC, and I understand are mostly unused. Thwaites has this graph:
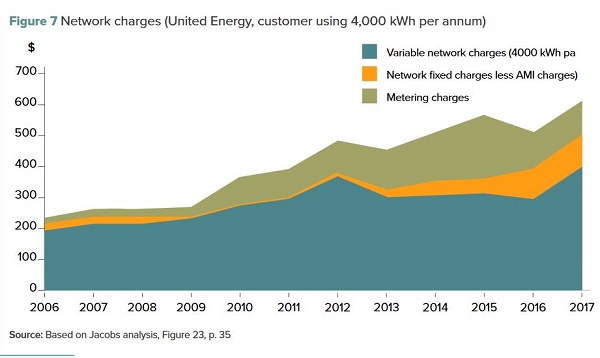
Apart from the metering Thwaites says the cost drivers in Victoria have not so much been network charges, rather retail charges, which end up being the largest component. Thwaites says the costs of competition, that is the costs of acquiring and keeping customers, are passed on to the customers themselves and clearly outweigh the benefits of competition.
Other than that the ACCC information does not appear to be as badly out of whack as with Queensland, although if you add in the metering the ACCC has $586 for networks as against $503 in Thwaites. This is hard to explain.
BilB has made a comment about Jess Hill’s 2014 article on gold-plating.
It’s a great article, and better for citing highly credible commenters like Bruce Mountain and Hugh Saddler. Rod Sims says the ACCC found that network spending drove prices from around 2009 especially in NSW and Queensland, and the article confirms this. However, it starts by saying that both networks were in a pretty shocking state and it doesn’t really differentiate between necessary and unnecessary spending in those states specifically. It rightly says that increased usage that didn’t eventuate had been used as an argument, and points out that you have to build for peaks rather than total usage, but the article itself wanders between the two.
Much of the article is about NSW and points to corruption. I believe that NSW was also cranking up the value somewhat with a view to selling the network.
The article also identifies the issue of switching to the national regulator, the Australian Energy Regulator, who in the event and possibly by design was a weak regulator.
Also she mentions the issue of stricter standards for outages, which Giles Parkinson has been saying are high by world standards, having been set at no more than 0.002% of the time.
Mountain says:
- in New South Wales and Queensland, about two thirds was spent on augmentation [building for peak demand], and about a third in Victoria.”
and overall:
- half the money spent by the networks – more than $20 billion – was wasted on infrastructure we don’t need.
Troubling indeed, but there is still room for a larger, more quantified story about each state. Right now we understand from Hugh Grant that the Queensland government is taking about $3 billion pa out of the electricity system, compared to $5 billion by the LNP government, but we don’t know how that divides between networks and generation.
Update 4: I’ve just had another look at the post Retailers gouging electricity prices: Grattan, which has these two interesting graphs. First:
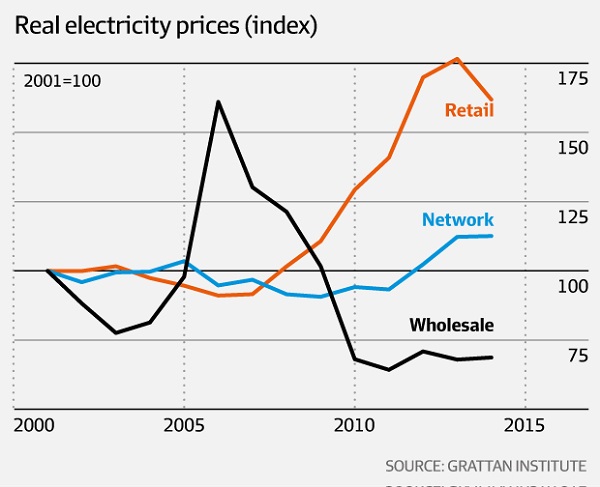
That graph shows that wholesale prices fell after 2005, and have been flat from 2010, network costs have risen moderately, but retail prices have rocketed.
Second:
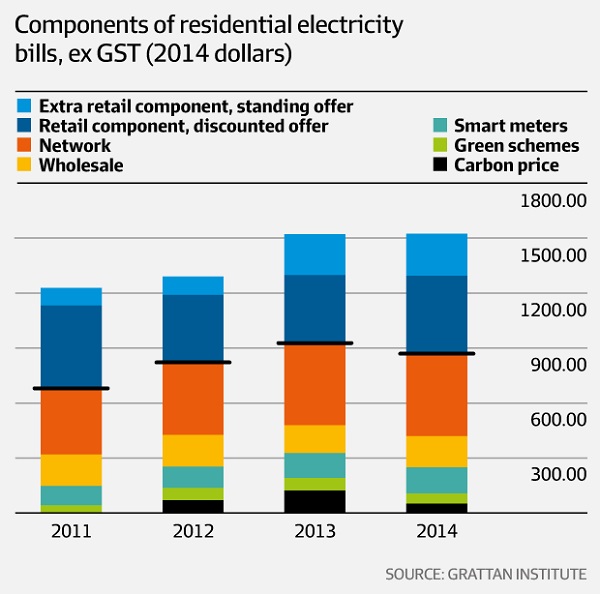
Networks are way less than 50% and wholesale, the actual electricity, is minuscule.
Then there was this graph from a GetUp report in mid-2016 which came to me via the AFR:
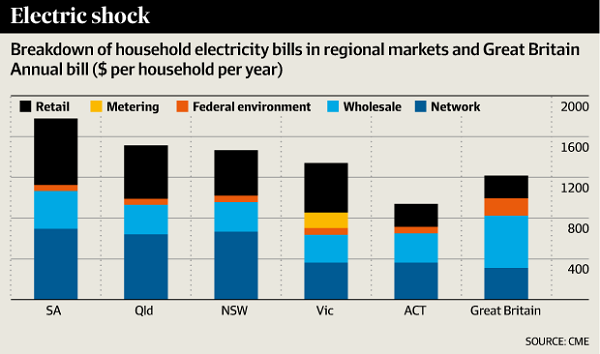
The figures are different from and less than those in the ACCC report.
Please note, the Thwaites information in update 3 is attributed to CME, which means Bruce Mountain.
Update 4:
The Queensland Competition Authority found regional bills averaged $1490 in 2016-17 and as a result of the 3.3% increase would be $1539 in the coming year, up $49.

Impressive set of figures Brian but it is a bit hard to reduce it to simple messages. The most important to me was the split up of the bills in fig 2.7 with, for Qld only 24% of the household bill coming from power generation while the gold plated network costed 50% and 26% retail costs.
Makes cooperative microgrids that protect consumers from the lurk merchants look very attractive.
Congratulations to Queenslanders for having installed the largest proportion of rooftop solar PV, at present.
Cheers.
Good to point out that many households in Victoria use Bass Strait natural gas domestically: cooking, heating and hot water.
The pipeline network took decades to extend to smaller country towns.
When we installed solar hot water nine or so years ago, State Govt subsidy was payable only if gas hot water backup was installed, rather than electric (brown coal) backup.
A nod to reducing C emissions.
I agree with your comment, John D. The great power con to maximise returns for the electricity industry players which resulted in the bloated electricity wheeling margin (up till 2007 wheeling was one third of the then retail price of 13 cents per unit = 4.5 cents per unit, now with wheeling at 50% of 24 cents per unit = 12 cents), will in time be their downfall as it makes the sharing of distributed energy across the grid un workable. So people will microgrid share power very locally and efficiently. IMHO.
John D and BilB, in respose to your comments, I’ve done the following update:
Perhaps, in the light of comments below from John D and BilB I should have posted this graph of the Queensland residential bills for 2016-17:
I want to make it clear that I’m disbelieving this graph on two counts.
Firstly, on our electricity bill in front of me for the quarter ending 15 September 2017 it says that the supply charge goes up from July 1 from $0.89567 per day to $1.00 per day, a fair hike, but it leaves us with $365 pa, to which GST is added, but we get a discount taken off the end of 13% for paying on time. But the standard offer is $401.50 pa GST included, which is a long way short of $843.
The only other substantial charge is the usage charge, which is currently $0.26 per kWh. I know that it is said that you can now put solar on your roof for $0.19 per kWh, but that depends on a lot of stuff like the orientation of your roof, the pay-back period and how long you anticipate staying.
For the sake of this argument that is by the by.
The second problem is that information from the Australian Energy Council and Acil-Allen indicate an average bill of a little over $1300 pa, not $1955.
Until these anomalies are resolved no useful generalisations can be made on the ACCC information.
Until this is straightened out, I’m saying the ACCC information is rubbish.
That said your general comment about local generation and microgrids being the future is no doubt valid. I was going to say the same myself, but I wanted to limit the post to the points I made.
On gold-plating the network, I’m not so sure that it applies in equal force in Queensland. As I’ve said many times we have special problems with decentralisation, topography, extreme weather and foliage growth.
Recently on local radio recently we heard from a southern expert telling us we’d gold-plated because of a few storms, to the next item, which is pretty routine for the summer, about x thousand consumers without power because of the storms the previous night.
There are several sources of data that could be used, Brian.
On our regular power bill, they give “average” consumption figures for the area we live in. Presumably not just plucked out of the air. Retail companies must be sitting on huge volumes of such data.
Of course, if a household has a standard (Peter Garrett) 1 kW installed rooftop PV, it would be using maybe 20% more than it purchases, but adjustment can be made.
Ambi, the ACCC makes the point that there are different ways of going about determining average bills, beginning with how you define a residence.
However, there are not different ways I can read my bill in black and white in front of me.
I’ve done another set of calculations based on a network charge of $0.8957 per day, which was the charge in 2016-17. That gives us $326.93 pa or $359.62 with GST. That is about $483 less than the ACCC figure of $843.
If you subtract $483 from $1955 the corrected bill per annum becomes 1472.
Network charges of $359.62 represent 24.4% of the annual figure.
I’ve heard that the industry was less than completely forthcoming with the ACCC, which may explain why, but there seems to be a major balls up in the figures.
I’m very happy to be proved wrong, but meanwhile must run with the concrete evidence.
Ambi, the ACCC was not looking at how much a household uses in total, just how much it pays the electricity retailer.
Brian,
The experts tell us that it’s the price of gas that determines the wholesale price of electricity here in Australia, because it’s the gas-fired power stations that provide ‘dispatchable’ electricity. ‘Baseload’ coal-fired power stations are not ‘dispatchable’ (despite what some politicians & commentators say), because they cannot ramp-up or ramp-down to match demand fast enough, like gas-fired power stations can. Solar-PV and wind are intermittent and therefore are not considered ‘firm’ or dispatchable’ unless coupled with storage, which increases their LCOE considerably.
Last week, Matt at crudeoilpeak.info posted this piece headlined Australia’s east coast gas crisis will be permanent. His Figures #6 & #7 are important, because what I think they say is that there will be less and less low cost to extract gas, and what’s left will be more and more expensive.
Matt’ conclusion states:
I think he makes a compelling case, which means the Australian east coast gas supply is only going to get more expensive, not cheaper. That means if the NEM continues to rely upon gas-fired power stations then electricity prices are only going to get higher. Those that can afford to install solar-PV plus battery storage will be better off, but that risks a “death spiral” as those that cannot afford to add PV+batteries are left to pay for more and more expensive grid power.
Brian at 9.33am
Yes.
Ambi, later when I get time I’ll have a look at the Victorian inquiry into prices and see how it matches ACCC. If anyone can get there before me I’d appreciate it.
Geoff M, in the post I didn’t go into what had made the prices rise, because, frankly, at present I’m lacking confidence in the ACCC’s information.
However, the major stories appear to be investment in the networks from about 2009, then for a bit the carbon pricing, and from about 2014-15 the price of gas when the CSG production exported through Gladstone kicked into gear.
I did see an article by Matthew Stevens in the AFR saying gas prices are not going to come down. The link you provide goes into more detail and confirms that.
I’ve been saying that the AGL move to put a floating gas import terminal off Victoria might limit prices, at least for AGL.
There is also a pipeline being built from Tennant Creek to Mt Isa, not sure when it comes on board and what difference it would make.
Queensland is busy releasing new tenements, but Stevens says all the cheap gas has been found, and allowing CSG in NSW and Victoria would not make any substantial difference.
I agree, Brian, that the first ACCC graphic is unbelievable. It certainly does not match anything that I can see on my bills. Electricity in NSW is 24cents /kWhr not 35 as per the ACCC graphic comparison to other countries.
The other factor is the relevance of the figures. I just looked through the factory electricity account and in the last 4 years the electricity cost has been around 0.4% of gross turnover. Hardly a significant cost. In the last 6 months that has reduced by 30% due to passing machined componentry over to external contractors, the installation of LED lighting, and upgrading our compressed air system with a more efficient compressor and eliminating leaks.
The size of the bill is more relevant to households, but even there it will mostly be just 2 to 4 percent of the total household budget.
My advice, when people start talking about electricity bills ask them the size of the revenue stream that is supporting that expenditure.
Brian: If your graph showing generation cost is only 24% of the bill it is a bit hard to argue that the price of gas is driving the whole circus.
I haven’t got a link but Giles Parkinson used to claim that what was really driving up power prices was the rapid growth in air conditioning. This meant that the cost of power during the hottest part of the year was much much higher than normal and was responsible for a large proportion of the annual householders bill. (Peak spot price last summer was something like 1400 cents per kWh) Rooftop solar has helped because nobody pay rooftop spot prices and solar peaks during cloud free daytime.
It is always worth noting that grid capacity drops during hot days and the gold plating would have been aimed at ensuring future high temperature loading could be handled.
Rooftop solar was driving down household bills in 2012
That is a damn good point, JohnD. I think I get a 6 cent credit for the electricity my rooftop feeds into the grid. That energy certainly never leaves my local area, it just feeds to nearby properties that are consuming electricity. The grid operators get to charge for the wheeling without providing that service, let alone the profit of the spot price offset on extreme days.
From what I can see is that this only increases profit for the grid operators but does not necessarily reduce prices.
John, my argument is that we can’t take the ACCC graphs as meaning anything. If the cost of networks is actually not 50% but nearer half that, as I suspect, it follows that generation occupies a larger part of the bill, possibly 50%. It’s hard to get a handle.
The green part has disappeared from the Qld bill, and other studies have put the cost on retail as higher than ACCC, or around 30%.
I have no doubt that aircon is a big factor. Working in other peoples yards I started to see aircon installed in the houses of people who are not all that well off in the 1990s. Now it is common everywhere.
Last weekend I went to an open house inspection of a new house on a 405 sq m block that has 346 sq m under roof and aircon throughout. On my evening walk a few days earlier I had a conversation with the developer. He said it had an 18 KW aircon system with individual controls in every room.
Aircon might be driving it, but when the sun goes down and all the aircon comes on the gas is turned up to cope.
From memory, I think I posted somewhere recently that gas is now determining the price 30% of the time, whereas it used to be a fraction of that.
I get confused with my zeroes and decimal places, but I think your 1400 cents per kWh equates to $14,000 per MWh, which is the maximum allowed in the NEM. It is simply choked off at that point.
And yes it did get that high, not because generators were gaming the system, but because demand exceeded supply and you couldn’t buy power at any price. The spot market hit the limit. That’s what the AER investigation found.
And some of the generators cooked in the heat. They investigate all instances where the price exceeds $5000 MWh.
Brian, does this 2014 Jess Hill article explain a little more about how the transmission infrastructure (wheeling) permanently inflated the electricity bills?
https://www.themonthly.com.au/issue/2014/july/1404136800/jess-hill/power-corrupts
Considering the air-conditioning aspect brings up another disastrous Abbott consequence, the home insulation saga.
A year back I spent two weeks working at the warehouse of my European distributor in the Netherlands. That whole time I wore only light winter ware as the whole warehouse is well insulated and heating is largely achieved with a ground thermal mass system.
Had we not been plagued with the political madness of Abbott Australian homes, including mine, would have been better insulated and the air-conditioning load on the national grid would have been considerably reduced.
So don’t forget to add the home insulation initiative collapse to Peta Credlin’s admission that everything that was done by Abbott, and this one includes Turnbull, was done purely to advance the political aims of Abbott and the LNP, and NOT to serve the interests of Australians.
As the summer heat comes on this will be a time to remind people that they are suffering in the heat and dark principally because the LNP was desperate to gain government.
I am going to have to work on this sentence to get it fully correct
As the summer heat comes on this will be a time to remind people that they are suffering super cyclones, blast furnace bushfires, in the heat and dark, with a failing internet connection entirely because the LNP was desperate to gain government at all costs.
Brian: I converted the $14000 per MWh to cents per kWh because people get their bills in terms of cents per kWh. ($10 per MWh=one cent per kWh.)
Bilb: That was a good link on the network scandal.
John, that’s fine, it’s just that when people talk about spot prices in the industry they seem to use MWh.
I’ve done a further update to the post, which I’ll repeat here:
I’ve had a quick look at the Thwaites inquiry, the Independent Review into the Electricity & Gas Retail Markets in Victoria.
It looked at household costs by studying actual bills in categories according to how much they used. Here is the disaggregated average bill for 2016-2017:
That is for households using 4 MWh pa.
Actual electricity forms about 19% of the bill, network charges apart from metering about 30% and retail also 30%.
Here is the most comparable graph from ACCC:
The ACCC has used information from the retailers, AER wholesale information, and network tariff information. It averages the usage on table 1.1 at 4800 kWh.
I’ve highlighted the word average because Thwaites elsewhere compares average bills to median bills from each retailer. Median bills in most cases are more than 10% less than the average. I suggest that median should be taken to mean typical.
In Victoria there was a program of compulsory issue of smart metres, which end up in network costs in the ACCC, and I understand are mostly unused. Thwaites has this graph:
Apart from the metering Thwaites says the cost drivers in Victoria have not so much been network charges, rather retail charges, which end up being the largest component. Thwaites says the costs of competition, that is the costs of acquiring and keeping customers, are passed on to the customers themselves and clearly outweigh the benefits of competition.
Other than that the ACCC information does not appear to be as badly out of whack as with Queensland, although if you add in the metering the ACCC has $586 for networks as against $503 in Thwaites. This is hard to explain.
BilB has made a comment about Jess Hill’s 2014 article on gold-plating.
It’s a great article, and better for citing highly credible commenters like Bruce Mountain and Hugh Saddler. Rod Sims says the ACCC found that network spending drove prices from around 2009 especially in NSW and Queensland, and the article confirms this. However, it starts by saying that both networks were in a pretty shocking state and it doesn’t really differentiate between necessary and unnecessary spending in those states specifically. It rightly says that increased usage that didn’t appear was used as an argument, and points out that you have to build for peaks rather than total usage, but the article itself wanders between the two.
Much of the article is about NSW and points to corruption. I believe that NSW was also cranking up the value somewhat with a view to selling the network.
The article also identifies the issue of switching to the national regulator, the Australian Energy Regulator, who in the event and possibly by design was a weak regulator.
Also she mentions the issue of stricter standards, which Giles Parkinson has been staying are high by world standards, of outages not comprising more 0.002% of the time.
Mountain says:
in New South Wales and Queensland, about two thirds was spent on augmentation [building for peak demand], and about a third in Victoria.”
and overall:
half the money spent by the networks – more than $20 billion – was wasted on infrastructure we don’t need.
Troubling indeed, but there is still room for a larger, more quantified story about each state. Right now we understand from Hugh Grant that the Queensland government is taking about $3 billion pa out of the electricity system, compared to $5 billion by the LNP government, but we don’t know how that divides between networks and generation.
So in 2009 QLD Premier was Bligh but it could have been initiated by Beatie.
In NSW the Premier was Kennelly but more likely Iemma was the culprit.
Anyone see a trend ?
Brian correction at 5.03 I suspect 4000 kWhrs or 4 mWhrs
BilB, thanks, it’s 4 MWh. I grew up on Imperial and this decimal stuff has always given me grief for some reason.
Jumpy, no I don’t see a pattern. Clearly there was corruption in NSW, probably empire building in both states on the part of the electricity grid operators. I don’t see any reason why beattie or Bligh would want to overbuild a network.
I’ve done a fourth update. That’s probably as far as I can take it.
I’ve just had another look at the post Retailers gouging electricity prices: Grattan, which has these two interesting graphs. First:
That graph shows that wholesale prices fell after 2005, and have been flat from 2010, network costs have risen moderately, but retail prices have rocketed.
Second:
Networks are way less than 50% and wholesale, the actual electricity is minuscule.
Then there was this graph from a GetUp report in mid-2016 which came to me via the AFR:
The figures are different and less than the ACCC.
Please note, the Thwaites information is attributed to CME, which means Bruce Mountain.
So the dramatic switch ( 1st graph ) between retail and wholesale happened how ?
And under whose watch?
Brian, to understand Victoria’s large metering margin it might help to read this article. I don’t know what the deal set up within Victoria was or whether Victoria has any lingering commitment, but it is worth asking the question.
http://www.smh.com.au/business/smart-meters-but-at-whose-expense-20121223-2btjd.html
and after making that ill considered purchase this is the unravelling
https://www.reuters.com/article/us-landis-gyr-ipo-toshiba/smart-meter-maker-landisgyr-plans-ipo-sale-still-an-option-idUSKBN19O0E2
You’ve unearthed a lot of really good material in this thread, Brian. I am going to go through getup’s homegrown energy plan thoroughly. Thanks.
Jumpy, to be honest I think the initial drivers came during the 1990s under Paul Keating’s watch. There was a general orientation towards the privatisation of state-owned assets and competition was seen as the way to go. Competition policy I think was being driven by the Productivity Commission. The first national electricity law I think dates from 1996, and if it was passed under Howard’s watch it was most likely being planned by COAG under Keating.
It all took a while to crank up. The National Electricity Market with AEMO calling bids for spot prices didn’t happen until 2009.
Some states privatised generation, transmission and distribution. In Qld the policy was corporatisation with state ownership. Corporatisation meant that the entity was able to act with its own board and did not have to act like a government department in hiring, firing, buying, selling and budgeting. I know that happened to SEQEB well before 2000.
Private retailing came a bit later than most functions. This table comes from the ACCC report:
The dark blue is inappropriately labelled as “Full retail contestability, regulated prices”, because regional Qld does not have full retail contestability, it has a standard offer, collected by Ergon.
In SEQ Beattie introduced private retailers in 2006, but there was full contestability had to wait 10 years.
For anyone with eyes to see retail privatisation has been a disaster, but the ACCC says we need more, not less.
The stripe of the government does not make much difference in all this, but Goss had the smarts to hang onto public ownership.
BilB thanks for the links on smart metering.
I’m not a full bottle on it, but I thought it was to enable real time pricing, and energy sharing as in microgrids.
The Thwaites inquiry found that many people just wanted a basic ‘no frills’ service which they called the Basic Service Offer, where you just flick the switch, pay a standard rate, don’t have to shop around, and don’t get dudded.
Ambigulous (Re: OCTOBER 27, 2017 AT 6:16 PM):
In my experience, it’s more cost-effective long-term to switch to:
split-system reverse-cycle air conditioning, preferably during the day utilising solar-PV energy when available, replacing gas, for space heating needs; and
heat-pump hot water storage system programmed to run during the day to utilise solar-PV energy when available, replacing gas hot water system.
Although there has been a substantial investment in equipment, some ageing/failing equipment needed replacement anyway; the rewards are now paying off with substantially lower energy bills, compared with before the changes.
Please see The Conversation article by Tim Forcey, headlined 22 ways to cut your energy bills (before spending on solar panels), particularly solutions 20, 21 and 22.
Battery storage would be a useful addition, but I think the capital costs are not sufficiently attractive yet, to justify a reasonable payback period, but hopefully that will change in a few years’ time.