In Climate clippings 175, Item 4, I made reference to the Bloomberg New energy outlook, 2016 report which identifies eight “massive” shifts coming soon to power markets. In this post I’d like to take a closer look.
The summary sentence tells us that “coal and gas will begin their terminal decline in less than a decade”. Frequently the title of an article and the summary lead-in sentence are not written by the authors. In this case the “terminal decline” of coal and gas is more than a little misleading.
They do say that demand for coal and gas is peaking ahead of schedule because electric cars and affordable battery storage for renewable power are arriving faster than expected, as are changes in China’s energy mix. But what does this actually mean as the scenario is played out? We’ll look briefly at each shift they nominate.
1. There will be no golden age of gas
Gas has decimated the US coal market, but on a global scale the costs of wind and solar power are falling too quickly for gas ever to dominate. This is how they see the market working out:
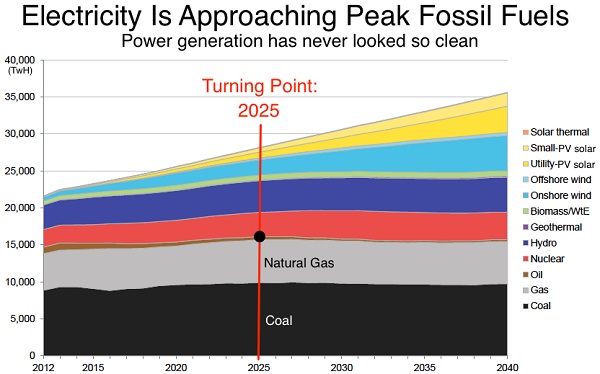
The peak comes in 2025, but then coal and gas plateau rather than decline.
2. Renewables attract $7.8 trillion
The lifetime cost of wind and solar is already less than the cost of building new fossil fuel plants in many regions.
Investment in new capacity will be $7.8 trillion in renewables, including $3.4 trillion for solar and $3.1 trillion for wind, plus $911 billion for hydro power. New gas and coal will attract $2.1 trillion through 2040. Here’s the graph:
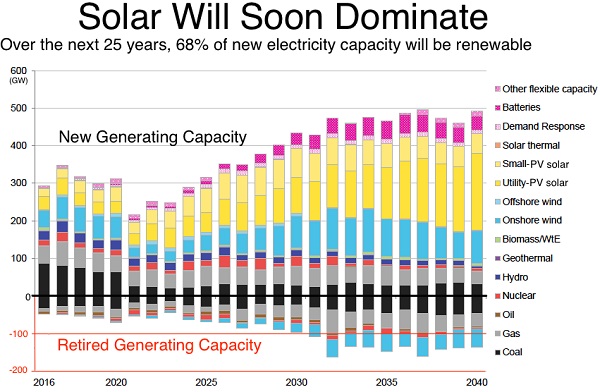
The pink bits at the top are batteries and other flexible capacity. They say that by 2028, batteries will be as ubiquitous as rooftop solar is today.
To me it does not seem enough, and I suspect that gas delivered through the grid may play a bigger role than some expect.
Old coal and gas retired will be matched by new, it seems.
3. Electric cars rescue power markets
Electric cars are becoming mainstream and are on the verge of disrupting oil markets. However, they will require power, also at night, constituting additional demand for electricity.
4. Batteries join the grid
- The scale-up of electric cars increases demand for renewable energy and drives down the cost of batteries. And as those costs fall, batteries can increasingly be used to store solar power.
5. Solar and wind prices plummet
For every doubling in the world’s solar panels, costs fall by 26 percent:
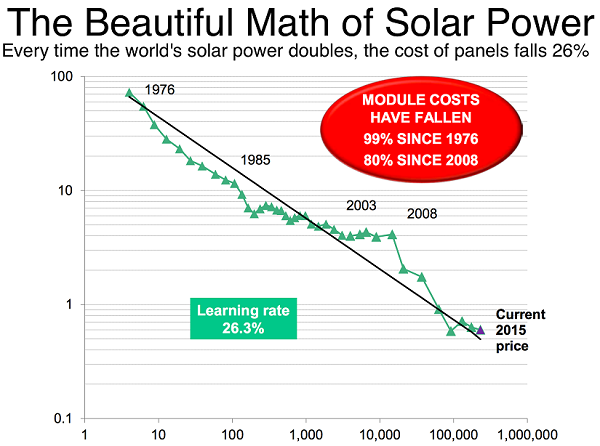
Wind-power prices are also falling too — 19 percent for every doubling.
6. Capacity factors go wild
The wind doesn’t blow full blast all the time. Averaged over a year a wind turbine might yield 30% of maximum capacity. However, with better design some wind farms in Texas are now achieving capacity factors of 50%.
Wind and solar once built are free at the margin, so they are being preferred to gas and coal when available.
- As natural gas and coal plants are increasingly idled in favor of renewables, their capacity factors will take a big hit, and lifetime cost of those plants goes up. Think of them as the expensive back-up power for cheap renewables.
7. A new polluter to worry about
China looks as though it may reach peak emissions soon. However India represents an emerging threat:
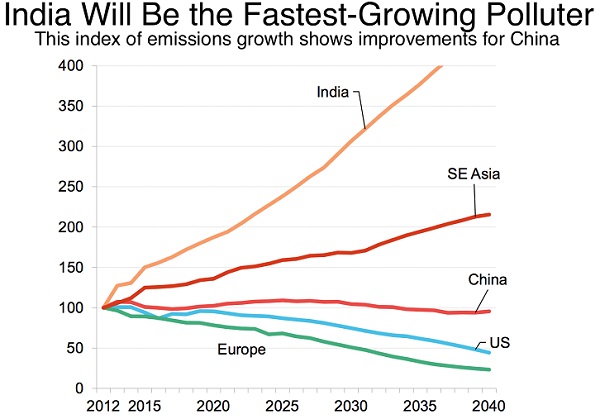
Frankly, the China graph looks optimistic.
Here are the top 10 emitters:
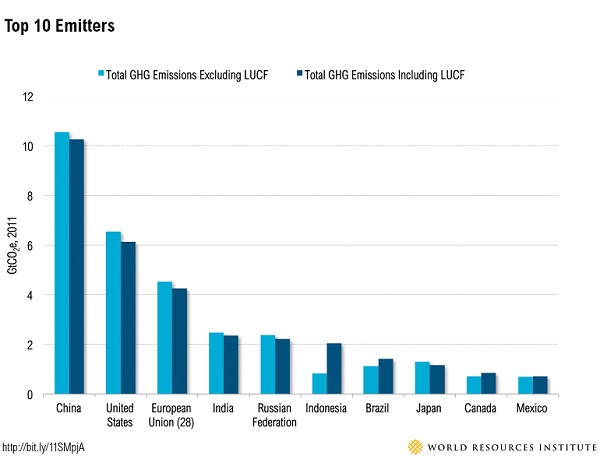
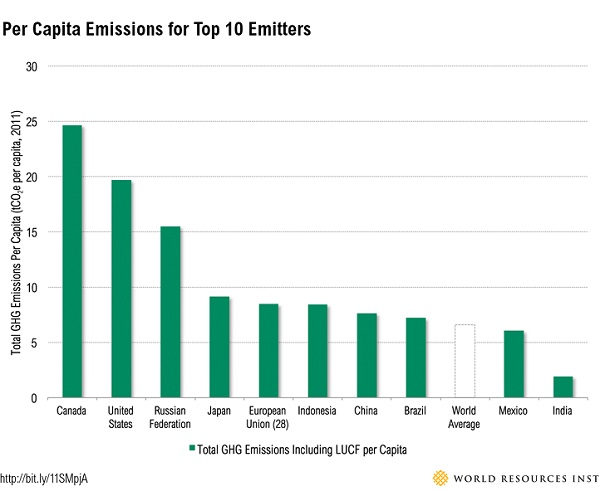
In per capita terms India is by far the lowest. Yet if they stay on course they’ll cook the planet.
Update: Here’s the per capita emissions of the top ten:
8. The transformation continues
The transformation of the energy markets continues to surprise, but as the matter stands we are going nowhere:
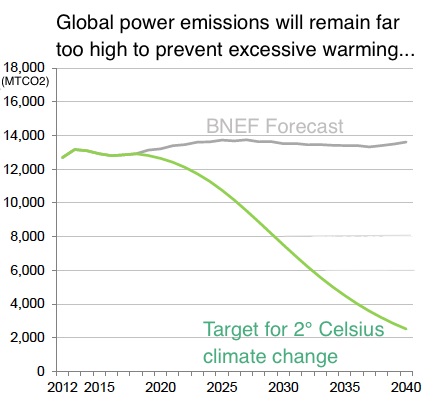
Which is better than we had been doing. Bloomberg estimates that we need another $5.3 trillion to limit warming to two degrees, which as you know is folly.

Thanks Brian, two comments:
It would be better to show per capita emissions alongside national emissions (as well as mentioning them). Otherwise it feeds into the blame shifting narrative – ‘it’s not us who are the problem, it’s the Chinese/Indians, Australia only makes a minute contribution to global emissions’, etc, etc, ad nauseum, which I’m sure we’ve all heard. (Don’t even start Jumpy, just in case you were thinking of it!)
The discussion at the end confirm my feeling that ‘technology alone won’t get us there, we have to change the way we live’ (the discussion on my blog you kindly mentioned some time ago*
http://fairgreenplanet.blogspot.com.au/2014/09/different-responses-to-climate-change.html).
I say ‘feeling’ advisedly because I think this issue is so complex that no amount of modelling could give us the perfect answer on this, at least yet. Certainly the public health field is strongly advocating for the health benefits of emissions reductions through more active lifestyles, plant based diets, better insulated homes, etc, to be taken into account in modelling – it got onto the agenda in the Paris Agreement, but there’s a long way to go.
(*my poor old blog has been completely neglected this year because I’m in the writing up stage of my thesis, but I’m going to try to update it soon.)
Also on the subject of the “folly” of two degrees, my local weather station, Essendon Airport, has records going back to 1931. I’ve been comparing current maximums with 1931-60 monthly averages, and so far this year we are tracking 1.8 above 1931-60. The lowest monthly deviation so far is this month (June) at +0.9 (which may decrease slightly further) and the highest was April at +3.2.
As far as I can work out, the BoM is saying that El Niño is not affecting our weather this calendar year (unlike last spring) so those temperature differences aren’t anomalies. It seems to put us awfully close to the folly of two degrees already.
Val, I think the weather effect of El Niño in terms of temperature is delayed by about three months, so it very much caused the high global temperatures early this year, to the extent that 2016 will almost certainly exceed 2015, even if we switch to La Nina.
I’ve inserted the per capita emissions as a update in the post, so if I can copy the code here, it should appear:
Val: It is a few years since I played with emission data. A few key points from this analysis should still be reasonably relevant:
-About 30% of world emissions came from countries with lower emissions than Australia -It is not just the big emitters that need to act.
-Australia was near the top of the per capita emissions. (Your graph doesn’t show Australia.)
G’day Val. Nice to see you.
I’m surprised solar and wind devices didn’t appear in the Retired Generating Capacity histogram. Some of these devices are quite durable but surely there is wear-&-tear as well as accidental damage that ought to be considered.
Graham, I was going to say that in Europe, especially Germany, when you saw a bunch of half a dozen wind towers, at least one would not be working. It was better in Poland and the Czech Republik, perhaps because they were newer.
Thanks Brian. Still amazed that with our ultraflat gibber deserts and open downs country, receiving what? percentage of the total sunlight that hits planet earth and with four out of five 8-octos cloud-free days that inland Australia isn’t the biggest producer of electric power in the world. Yes, there are major capital costs in reaching that status – but they are lower than the amount of money blown on gambling, on luxury housing and on pretty war-toys with a combat-survival life measured in minutes, not months. Even if 3 out of every 4 arrays were down at any one time, we would still have electricity to burn.
Is there a secret society of buggy-whip makers and phlogiston enthusiasts in our nation’s boardrooms and party rooms?
And that is not counting wind power, better designed devices and bearings, more intelligent use of energy and all the rest ….
Sorry Graham, that would sacred Aboriginal land with a plethora of endangered species on it.
The greens can’t let that happen.
Jumpy: The cost of power lines and the cost of paying people to work in places like that make rooftop solar look like a bargain.
Here’s Australia as a solar province. Basically world class:
We’ve boundless plains to share!
Brian: It is really a question of trading off things like solar radiation and the cost for various locations.
…. and the cost and feasibility of exporting any of the energy collected ….