 The WMO Statement on the Status of the Climate in 2015 was released on 23 March. In short, the world continues to warm, the seas continue to rise, and the weather becomes hotter, wetter and drier, with continued extreme conditions.
The UN has a useful summary, or go to the new WMO site, or access the pdf document directly.
There were reports on ABC RN’s The World Today and at Climate Central, but the best I found with images that go beyond the report was on our ABC. I’ll pick out some of the elements that interested me.
We know that the temperature went through the roof in 2015, easily beating previous records. This graph, referenced to the 1961-1990 average, identifies the years influenced by El Niño and La Niña:
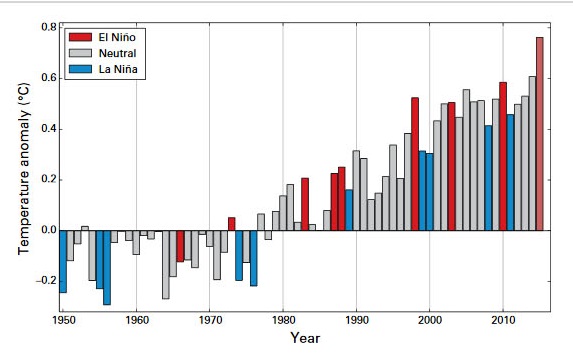
The graph represents the average of the three main global temperature datasets.
More than 90% of additional heat from climate change ends up in the oceans. The following graph shows the ocean heat content change for the top 700 metres, and the top 2000 metres since 2005:
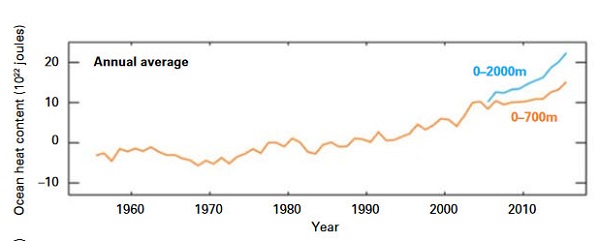
I believe about 40% of sea level rise comes from thermal expansion, so the uptick in the last couple of years makes sense.
This image shows broadly where it was wetter and drier:
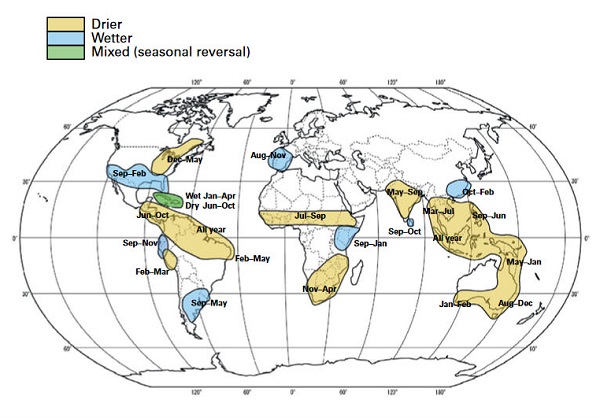
In some parts it was very wet, with weather that can only be described as erratic.
For example, despite near average rain for the year in Niger one 24-hour flooding episode killed 25 people. In Tanzania 50 died. For South Africa 2015 was the driest on record.
In Pakistan 90% of the seasonal total was concentrated over the first half of the season in areas which the rain seldom reaches. During March and April there was unseasonal weather, with heavy rain and late frost damaging crops. A rare tornado hit the Peshawar valley on 27 April and killed 45 people.
Yemen had the first cyclone ever to make landfall.
It was exceptionally hot in India, Pakistan and Iran, with temperatures over 45°C. This image shows the maximum temperatures for 24-30 May 2015:
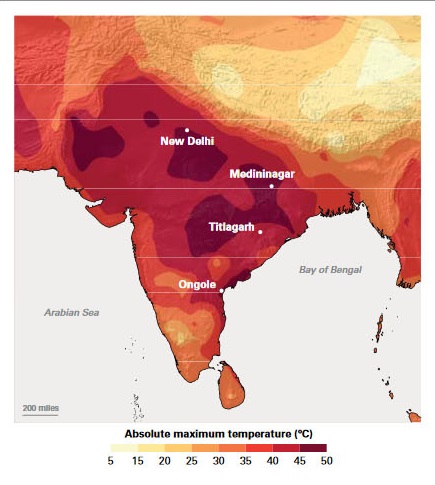
About 2500 people died due to the heat. In Pakistan from 17 to 24 June more than 1400 people died in the heat in Karachi and about 200 people in other parts of Sindh province.
Extreme heat is common in the pre-monsoon season on the Indian subcontinent, but the heat extended over a larger area than normal and was accompanied by exceptional humidity.
Argentina had its coldest October on record in a year that was the second warmest on record.
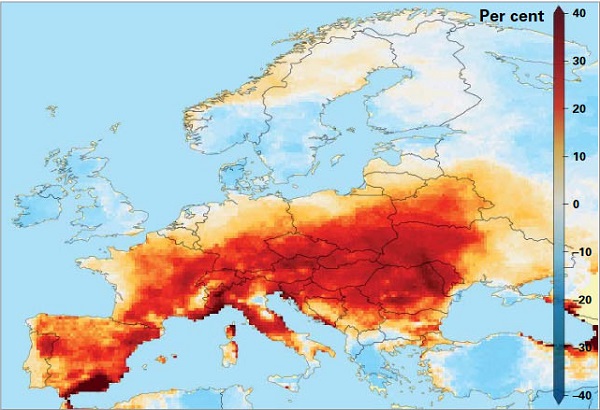
And so it goes. Europe’s summer was exceptionally warm. This image shows the average number of days exceeding the 90th percentile for the reference period 1981-2100, which in itself is a warm period:
Levels of CO2 in the atmosphere continue to rise, as does the rate of increase:
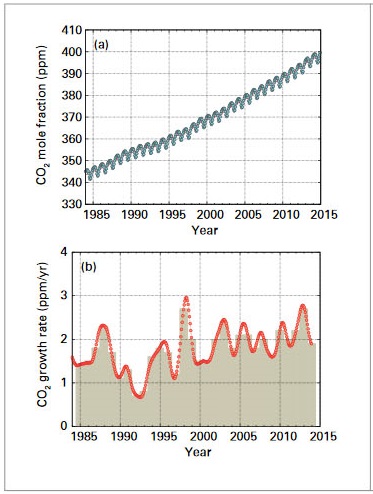
Preliminary NOAA data for 2015 indicate that the CO2 increase of 3.01 ppm/year was a record.
Methane and nitrous oxide give no cause for comfort:

In Australia the biggest distinguishing feature was the heat in October, which was a record and the biggest monthly anomaly, in a year which was only the fifth hottest.
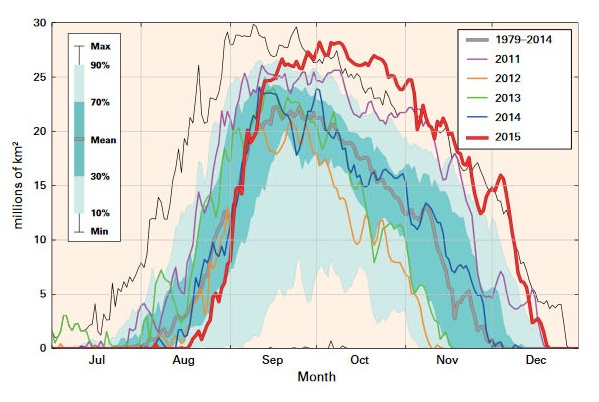
People tend to think of the oxone layer problem as being fixed. While the use of halons and chlorofluorocarbons has been discontinued, they will persist in the atmosphere for many decades. The oxone hole still appears and depends on the meteorological conditions. 2015 was not a good year:
At the other end of the globe, Alaska had record wildfires and in Greenland they recorded the equal record low of –55.2°C.
I’ll finish with the message from the WMO Secretary-General:
- “Today the Earth is already 1°C hotter than at the start of the twentieth century. We are halfway to the critical 2°C threshold. National climate change plans adopted so far may not be enough to avoid a temperature rise of 3°C, but we can avert the worst-case scenarios with urgent and far-reaching measures to cut carbon dioxide emissions,” WMO Secretary-General Petteri Taalas said.
“Our planet is sending a powerful message to world leaders to sign and implement the Paris Agreement on climate change and cut greenhouse gases now before we pass the point of no return,” he said.
There’s a lot of difference between signing and implementing.

Hi Brian, I guess you saw the article in the Guardian about the oil companies knowing about climate change 45 years ago http://www.theguardian.com/business/2016/apr/13/climate-change-oil-industry-environment-warning-1968
As has been discussed before, this is like the tobacco scenario, and no doubt in future states and corporations will be sued by people whose lives have been shortened by heatwaves etc, or their families. Depressingly similar.
Also Peabody filing for bankruptcy – here is Naomi Orestes’ comment https://twitter.com/tcktcktck/status/720183119022845952
Val: At this stage the bankruptcy is not shutting down Peabody coal mines. Companies have to be losing a lot of money before the creditors are better off with the mine shut down.
The Chatham Islands, south of New Zealand, looked like a good place to flee. But then, if they are affected by prolonged drought and the combined winds of the Roaring Forties and the Furious Fifties, they mightn’t be so attractive after all. Southern Patagonia anyone?
The Chatham Islands will be quite something once they get their coral reef. Hard to imagine a drought there.
John D apparently they had drought, followed by a direct hit from Cyclone Pam, then snow down to sea level.
Ivor on the JQ site found this awesome emissions calculator
http://www.carbonfootprint.com/calculator.aspx?tab=8
It is a pretty good tool to look at your emissions progress. my family at present comes out at under 3 tonnes each and when Hyundai come out with
http://insideevs.com/hyundai-estimates-electric-range-for-ioniq-phev-at-32-miles-ioniq-bev-at-155-miles/
there is the potential after a few other household technical improvements to bring that back to under one tonne each, and without any loss of life style. Others of course will use a lot more (powerboats and the like for recreation) but I think that the targets are achievable once more of the technologies mature. It is looking a lot better (prognosis) than it did six or eight years ago.
Brian: I wonder what the definition of drought is on the Chatham Islands?
John D, good point. When we were in NZ in January 1981 we went on a boat trip at Milford Sound. They told us there was a drought because it hadn’t rained for 36 hours!
Travelling north we heard at Greymouth that the town water supply was threatened because it hadn’t rained for five weeks.
Val, I hadn’t seen the article.
Scepticism is perhaps understandable, but the disinformation campaign is unforgivable.
Bilb that carbon footprint calculator was very interesting. Not sure how you can get to three when you have a car – I don’t even have a car and I’m almost at 3. However soon I intend to use my bike only for commuting (my workplace now has showers, lockers and towels – yea!) so that will reduce my tram use.
Secondary sources was the main component for me, however – over 2 of the total 2.9 – and in fairness to myself, they didn’t have quite enough options – I needed a ‘rarely buy anything new’ and ‘compost or recycle almost everything’ category, which would have brought my total down a bit.
Also it should possibly have allowed me some kind of deduction for the renewable energy I feed into the grid, I think. Other than that, it seemed a little more generous than some others I’ve tried. From what I gather, we need to reach about 2 tonnes per capita to be sustainable, so I guess we are both nearly there
Brian, yes the parallels with smoking have often been pointed out and Naomi Oreskes and her colleagues have pointed out that some of the same people are involved.
The cover up is unforgivable, in both cases. Let’s hope the general population become aware before too long – before the next election here, lets hope.
Btw I am involved in the end coal and divestment movements at the moment. I will send you some more information soon. I am not putting much on my own blog at present as I am working hard to finish my PhD and don’t have time, so I hope you can publicise it.
Val: The really big lie has been the idea that our choices are to destroy the economy or the planet
In reality the best thing we could do to get the economy going would be to launch a program aimed at replacing fossil carbon within a very low number of years.
Val, glad to help is I can.
Nicely put, John D.
John D. What really annoys me is that we have a tremendous wealth on non-carbon sources of energy that we do not use.
The sun burns four-fifths of Australia yet we do not bother to install even old-fashioned reflector-and-black pipe steam generators all over the place to give us electricity – let alone solar-panel systems.
The Roaring Forties belt the daylights out of western Tasmania throughout the year yet we don’t have forests of wind turbines there. Then, to add to our folly – or corruption – we drove Australia’s only manufacturer out of the country.
Australians were, traditionally, an inventive lot. No shortage of great energy saving ideas and devices – but efforts to get them to market are doomed to fail.
Then, to add insult to injury, the several thousand years supply of industrial feedstock we have in black coal is shipped overseas at rockbottom prices to be burnt up in coal-fired power stations.
Clever Country? Silly Country is more like it.