Turn down the heat : confronting the new climate normal is a massive 320 page report prepared for the World Bank by the Potsdam Institute for Climate Impact Research and Climate Analytics, and hence highly authoritative. The lead author was Hans Joachim (John) Schellnhuber of the Potsdam Institute.


From the Foreword:
There is growing evidence that warming close to 1.5°C above pre-industrial levels is locked-in to the Earth’s atmospheric system due to past and predicted emissions of greenhouse gases, and climate change impacts such as extreme heat events may now be unavoidable.
As the planet warms, climatic conditions, heat and other weather extremes which occur once in hundreds of years, if ever, and considered highly unusual or unprecedented today would become the “new climate normal” as we approach 4°C—a frightening world of increased risks and global instability.
The consequences for development would be severe as crop yields decline, water resources change, diseases move into new ranges, and sea levels rise. Ending poverty, increasing global prosperity and reducing global inequality, already difficult, will be much harder with 2°C warming, but at 4°C there is serious doubt whether these goals can be achieved at all. (Emphasis added)
Climate Progress has an excellent short summary. I’d like to comment on several aspects of the report which looked at climate impacts under three scenarios – the present climate of 0.8°C, a 2°C world and a 4°C world. The report focusses on three regions in considerable detail:

The report finds that overall 1.5°C warming is likely to be reached by 2050. If no mitigation action is taken we have a 40% chance of exceeding 4°C by 2100. If all countries that have made mitigation pledges follow them we can expect a median temperature rise of 3.1°C above pre-industrial.
In this the report is following the work done by UNEP, albeit in 2013. The 2014 UNEP report comes to similar conclusions. This should be seen as a critical endorsement of the UNEP report. Had they disagreed they would have said so.
Tipping points
Importantly Turn down the heat emphasises that if we breach 4°C the temperature is unlikely to stabilise at that point and will probably warm to 6°C or more. For a stable climate warming must be held below 2°C, because at that point significant tipping points could kick in.
For example in a 2°C world, the thawing of the Russian permafrost is projected to increase methane emissions by 20–30%.
Then the report looks in considerable detail at research on the Amazon. The short answer is that we don’t know with any precision what the impacts would be, but die-back and loss of forest cover could be a significant and increasing factor from about 1.8°C. At 4°C some studies see up to an 80% loss of forest cover. Other studies are less pessimistic.
What is not immediately apparent is that local temperatures will rise significantly more that global temperatures. A 4°C world could see local temperatures in the Amazon up to 10°C higher. A number of factors are at work.
Firstly, about 70% of the earth’s surface is ocean which warms about half as much as the land. Then as the forest warms and more droughts occur, there is die-back and an increased risk of fire. Without forest cover, warming increases. Also there is less rain as 28 to 48% of the Amazon rain comes from evapotranspiration of the forest. Hence dryer and warmer. In this way feedback loops are set up leading to further loss of carbon absorption capacity to the point where the Amazon could become a carbon source rather than a sink.
Crop yields
One of the concerns with warming is the change in crop yields. Here are some examples from Latin America and the Caribbean:
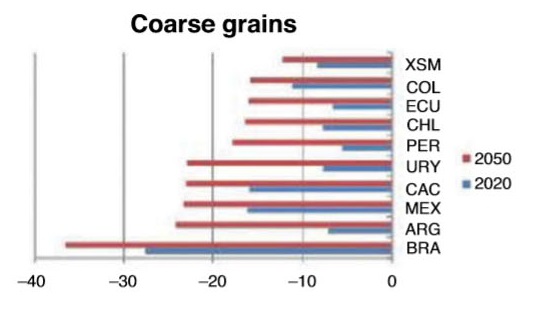
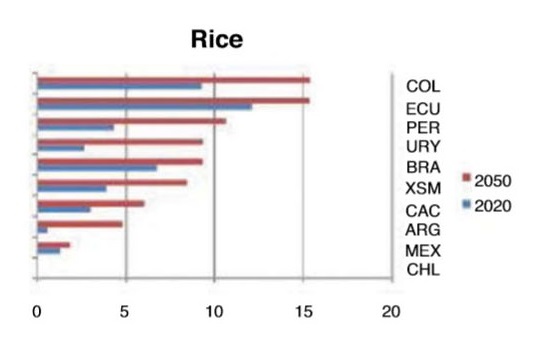
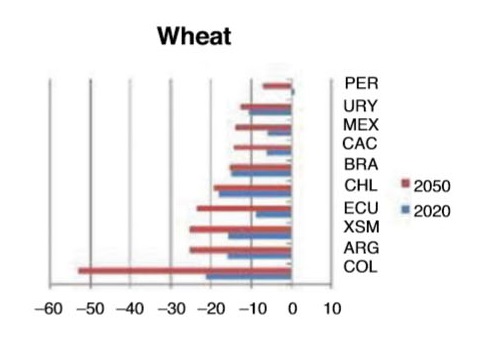
I’m surprised at how soon the effects kick in and how much they vary from one country to another. Obviously the news is not all bad with rice yields gaining. We can’t all grow rice, however, and the overall pattern is quite negative in terms of feeding a growing population and the social and economic disruption in the agrarian sector.
One of the problems with a warming world is more extreme weather, so more hot spells, droughts and floods. Life on the land becomes more uncertain as a result.
Sea level rise (SLR)
Sea level rise differs significantly in different coastal areas and the report documents expectations in detail. Overall they see greater rise by 2100 than the PCC report, because recent research not taken into account by the IPCC underestimates the fragility of the ice sheets. However, the difference is not substantial. In both cases sea level rise is seen as highly disruptive, as half to a metre will threaten many coastlines.
In both cases I find the long term projections surprisingly conservative. Over 2000 years they see current temperatures yielding 2.3 metres of SLR. At 2°C that becomes 3.6 and at 4°C a rise of 8 metres is forecast. I can’t get out of my mind Archer’s diagram of 2006:
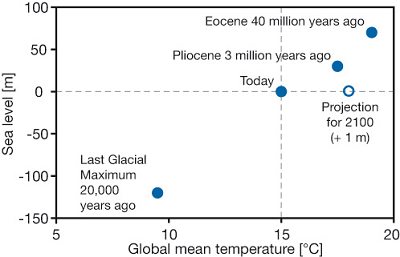
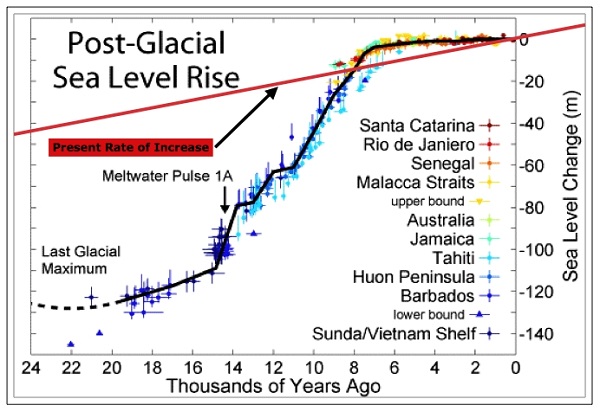
Coming out of the last ice age, with 5-6°C we had 120 metres of SLR. According to the paleo record with a further 4°C we can expect all the ice to be gone and a further 75 metres or so. That makes sense in such a powerful way that I will continue to believe it until it is addressed directly and shown to be wrong.
An explanation might be that SLR happens slowly and might take 3-6000 years. True enough but then we are forcing the system many times (25 to 30?) harder than it has been forced before. There is no precedent. And there has been a recent precedent for rapid SLR 14,000 years ago in what is called Meltwater Pulse 1A, when the waters rose a metre every 20 years for 400 years:
There is no room for complacency.
Conclusion
This report brings home that 2°C is dangerous. We really need to try to stay well clear of it. In Climate change: reconnecting politics with reality Professor John Wiseman spells out the strategies we need to adopt for rapid decarbonisation for the Centre for Policy Development. As I said there, I’d go a little harder, but I think his approach is sound. Total renewable power generation within 10 year, for example, sounds good to me.

Brian, this is the right conversation that we must be having. Unfortunately there are far too many who just do not want to know. Furthermore specific remedies are the beyond comprehension of democratic market driven societies.
But just as there are environmental tipping points, there also are technological tipping points. The most dramatic of which can be seen in cell phones initially and more dramatically in the smart phone wave triggered by Blackberry and then Apple’s 2 stage ipod which rolled into the iphone, which then set off the smart phone revolution.
This is why I have decided to, rather than focus on the disaster to come, focus on the one realistic solution that will provide tangible benefits to family households, the economy in due course and the environment by consequence.
Personal energy production is the only future that has the prospect of explosive roll out of the scale that smart phones have achieved. The key to sparking this off is to create the correct package of solar and sustainable features that provide a significant standard of living increase. Design integration is the key to achieving this. The complete household energy usage reality must be resolved with a one pass installation. For product designers we have some distance yet to go in this. Just as Apple labored for many years to bring together the complete packed that is the iphone the distributed solar energy system designers need to pull all of the available technologies together into one smoothly operating cohesive package that financiers can fund with confidence.
We will get there in the very near future. My occasional comments here are by way of gaging awareness and understanding. The feedback is instructive.
BilB more power to your arm! Germany is showing that the decentralised production of power is the way of the future. A neat way of packaging this option for people would be good. As it stands people wanting to go down this track have to do too much research.
The self contained logic should be taken further to include things like food production, 3 D printing etc.
The interesting question is how many m2 of sunlight would be required to support a person? Has implications for city design. At the moment the current trend is to put in more people per m2 of land. Maybe things need to be spread out to allow self contained to work.
With 7.6 million occupied private dwellings in 2006, JohnD, and assuming a suitable solar space per dwelling o 6m by 8m then the calculation of 48 x .2 Watts per square meter yield times 5.5 average solar hours time 275 solar days per years times 7.5 million we get 109 billion kwhrs per year or nearly half the total current electricity consumption, whereas the residential sector according to this fact sheet
http://www.aemc.gov.au/Media/docs/Commercial-and-industrial-use-c557f471-09b3-4018-b575-085aa555889c-0.pdf
amounts to just 22% of total electricity consumption.
That is just from PV panels. If the installed panels are PVT panels then that figure can rise from 109 billion to 142 billion kwhrs where the thermal energy collected is used to heat water and enclosed space alone. So there is already sufficient roof space to conservatively provide 2 thirds of our electricity. That is before we start to populate factory and commercial roof space.
These are basic calculations, obviously.
The food producing area required per person is another subject altogether.
Thanks Bilb. I was thinking of both food and solar. If you think of current trends towards high rise living roof space becomes and issue.
I was also thinking that jobs are less tied to location than they used to be.